Image
Figure Caption
Fig. 2
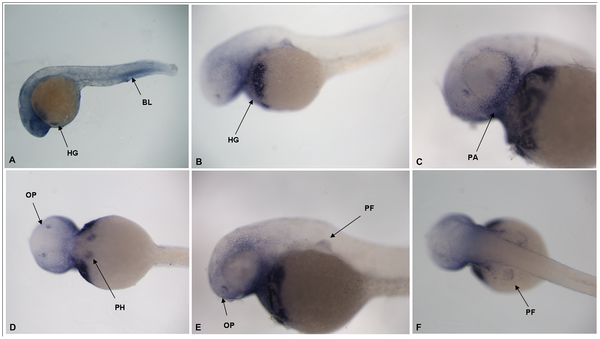
Shox gene expression in whole zebrafish embryos: 24 hpf embryo (HG = hatching gland) (A), view of hatching gland in 72 hpf embryo HG = hatching gland (B), close up of head region showing pharyngeal arch (PA) 72 hpf embryo (C), ventral view of 72 hpf embryo showing olfactory pits (OP) and putative heart (PH) (D), view of the pectoral fin (PF) in 72 hpf embryo (E) and dorsal view of pectoral fins (PF) in 72 hpf embryo (F).
Figure Data
Acknowledgments
This image is the copyrighted work of the attributed author or publisher, and
ZFIN has permission only to display this image to its users.
Additional permissions should be obtained from the applicable author or publisher of the image.
Full text @ PLoS One

