
|
Fig. 8
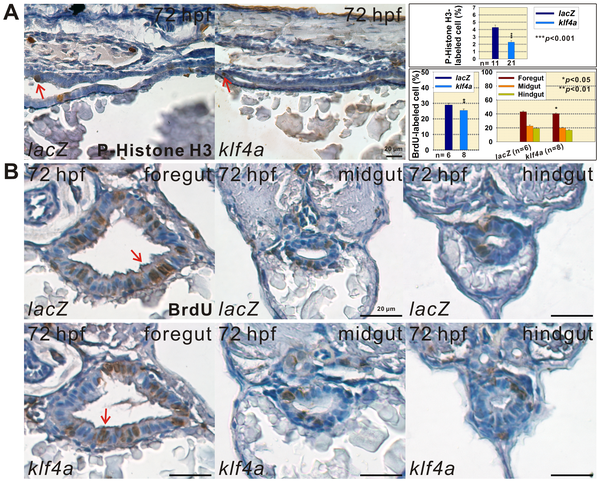
Decreased cell proliferation is detected in intestines of klf4a-overexpressed embryos.
(A) Images of p-Histone H3-stained cells in intestines of 72-hpf lacZ- and klf4a-overexpressed embryos are shown. Comparison of p-Histone H3-stained cell percentages in intestines of lacZ- and klf4a-overexpressed embryos is shown. Arrows indicate p-Histone H3-stained cells. Error bars indicate the standard error. Student′s t-test was conducted to compare klf4a- with lacZ-overexpressed embryos. (B) Images of BrdU-labeled cells in the foregut, midgut, and hindgut of 72-hpf lacZ- and klf4a-overexpressed embryos are shown. Comparison of BrdU-labeled cell percentages in intestines and in respective foregut, midgut, and hindgut of lacZ- and klf4a-overexpressed embryos are shown in panel A. Arrows indicate BrdU-labeled cells. Error bars indicate the standard error. Student′s t-test was conducted to compare klf4a- with lacZ-overexpressed embryos.