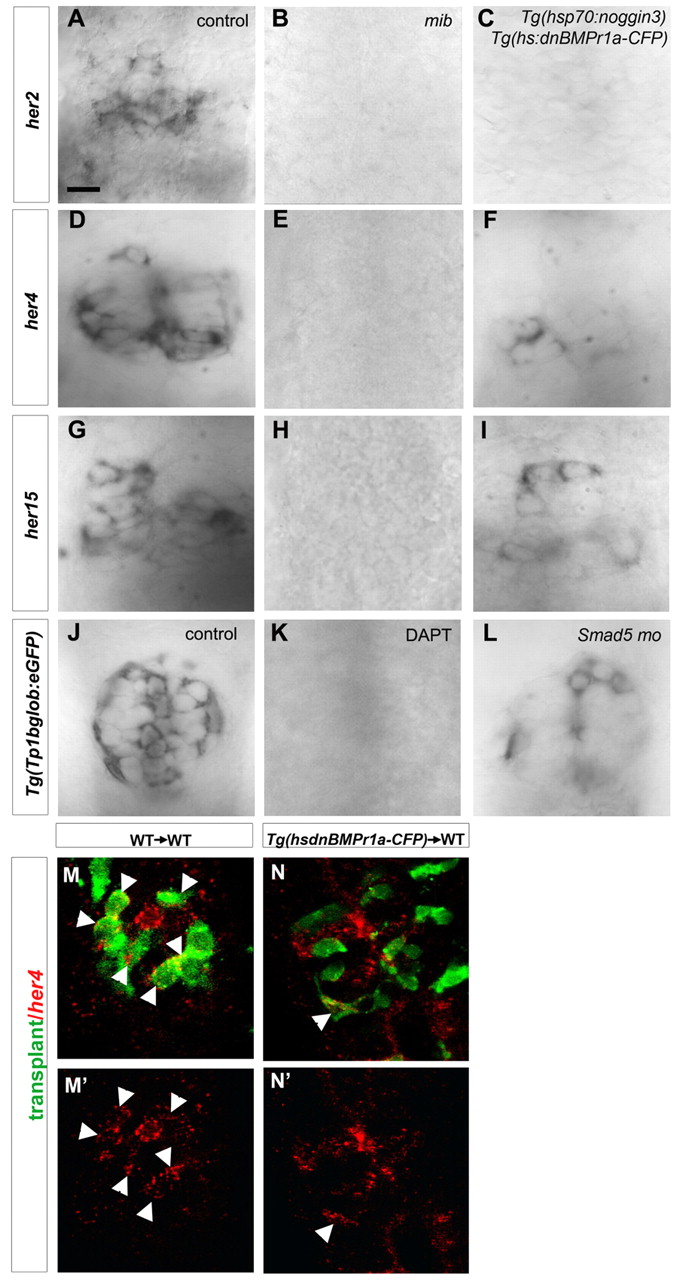
Fig. 6 BMP regulates Notch target gene expression. (A-I) Dorsal view of pineal glands showing expression of her genes in control (A,D,G), mib (B,E,H) and Tg(hs:dnBmpr1a-CFP);Tg(hsp70:noggin3) transgenic embryos (C,F,I) at 20 hours. For Tg(hs:dnBmpr1a-CFP);Tg(hsp70:noggin3) transgenic embryos, heat shocks were performed at 16 hours. (J-L) Dorsal view of pineal glands from mock-treated (J), DAPT-treated (K) or smad5-morphant (L) embryos. The effects of the various treatments were monitored by in situ hybridization against gfp transcripts in a Tg(Tp1bglob:eGFP) background. Anterior is upwards. Scale bar: 16 μm. (M-N′) Confocal sections of pineal glands of wild-type host having received cells transplanted from wild-type (M-M′) or Tg(hs:dnBmpr1a-CFP) donors (N-N′). Transplanted cells are shown in green, while expression of her4 mRNA is shown in red. White arrowheads highlight transplanted cells expressing her4.
Image
Figure Caption
Figure Data
Acknowledgments
This image is the copyrighted work of the attributed author or publisher, and
ZFIN has permission only to display this image to its users.
Additional permissions should be obtained from the applicable author or publisher of the image.
Full text @ Development

