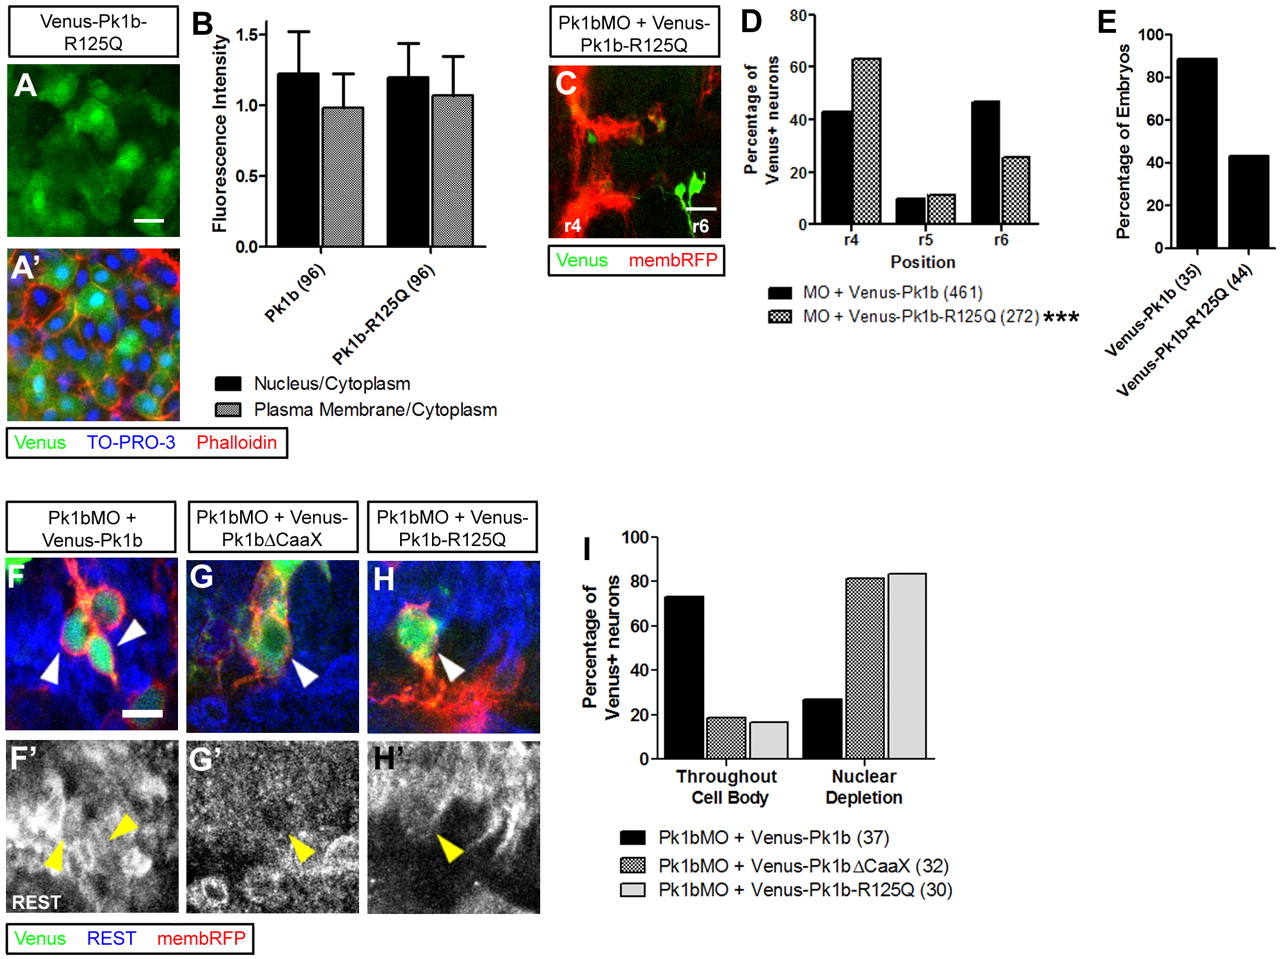
Fig. 7 Interaction with Pk1b is required for proper REST localization during FBMN migration. (A,A′) Zebrafish blastulae expressing Venus-Pk1b-R125Q (green), with nuclei (A′, blue) and plasma membrane (A′, red) labeled. (B) Ratio of fluorescence intensity in nuclei versus cytoplasm (black bars) and plasma membrane versus cytoplasm (gray bars). Number of cells scored is indicated in parentheses. Error bars indicate s.d. (C) Dorsal view of FBMNs (red) in representative 30 hpf Tg(zCREST1:membRFP) embryo injected with Pk1bMO and Venus-Pk1b-R125Q (green). (D) Venus-positive neurons were scored for their anteroposterior position and totaled. The percentage of neurons in r4-6 is shown. Numbers in parentheses indicate number of neurons scored. ***, P<0.001; χ2 test. (E) Percentage of embryos with migratory TgBMNs was scored. The number of embryos scored is indicated in parentheses. (F-H′) Dorsal views of FBMNs (red) in r4 of representative 30 hpf Tg(zCREST1:membRFP) embryos injected with Pk1bMO and Venus-Pk1b (E), Venus-Pk1bΔCaaX (F) or Venus-Pk1b-R125Q (G) (green). Embryos were immunostained for REST (blue). (E) REST is correctly localized in nuclei of Venus-Pk1b-positive neurons (arrowheads). (F,G) REST is depleted from nuclei of FBMNs expressing Venus-Pk1bΔCaaX or Venus-Pk1b-R125Q.F′-H′ show REST immunostaining alone (I) Venus-positive neurons in r4 were scored for localization of REST and totaled. The percentage of neurons is shown. The number of neurons scored is indicated in parentheses. Scale bars: 20 μm in A,C; 10 μm in F.
Image
Figure Caption
Acknowledgments
This image is the copyrighted work of the attributed author or publisher, and
ZFIN has permission only to display this image to its users.
Additional permissions should be obtained from the applicable author or publisher of the image.
Full text @ Development

