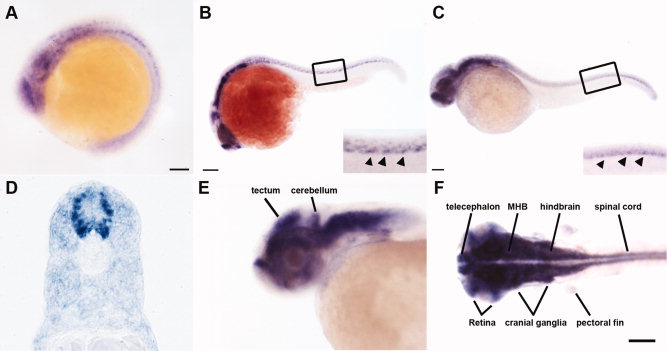
Fig. 2 thsd7a transcripts were detected in the zebrafish developing nervous system. Representative embryos show the spatiotemporal expression pattern of thsd7a transcripts by in situ hybridization. Anterior is to the left. A: thsd7a expression was first detected at 15 hours postfertilization (hpf). B: At 22 hours postfertilization (hpf). The inset image is an enlarged view of the boxed region. The unique thsd7a expression pattern along the ventral edge of neural tube is indicated by arrowheads. C: At 32 hpf. Expression of thsd7a along the ventral edge of neural tube is indicated by arrowheads in the inset image enlarged from boxed region. D: Cross-section through the trunk region at 32 hpf. E,F: At 48 hpf, thsd7a is expressed in the midbrain, hindbrain, midbrain?hindbrain boundary (MHB), cerebellum, telencephalon, tectum, retina, cranial ganglia, spinal cord, and pectoral fin. F: Dorsal view. Scale bars = 20 μm in A; 50 μm in B; 100 μm in C,F.
Image
Figure Caption
Figure Data
Acknowledgments
This image is the copyrighted work of the attributed author or publisher, and
ZFIN has permission only to display this image to its users.
Additional permissions should be obtained from the applicable author or publisher of the image.
Full text @ Dev. Dyn.

