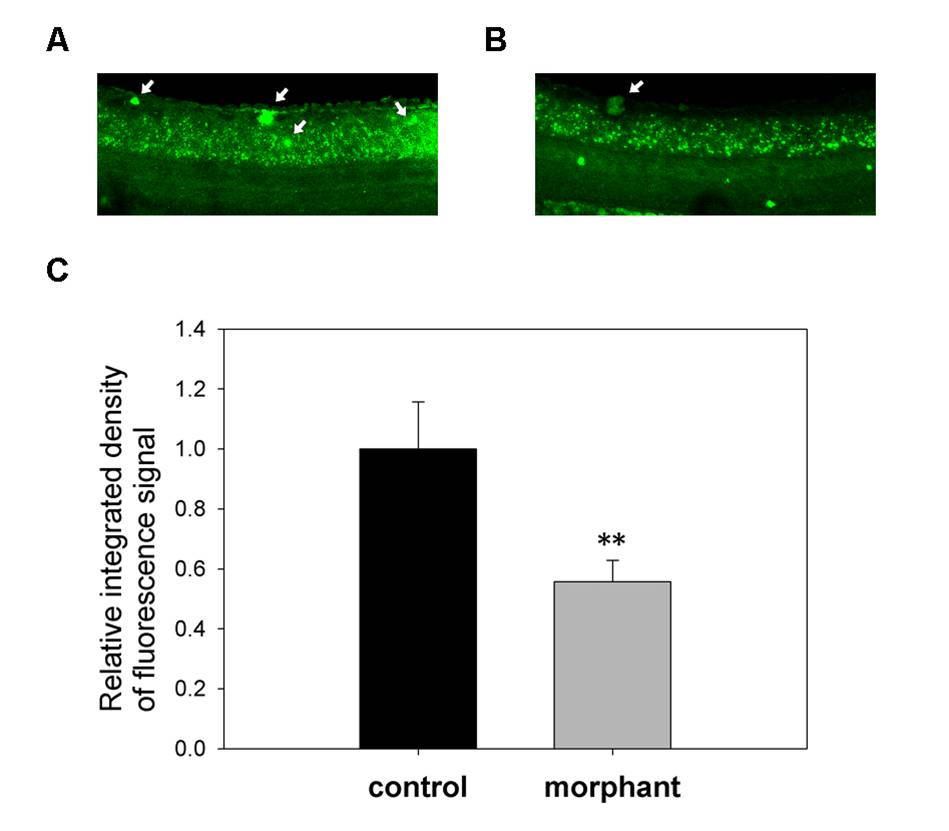
Fig. S3 Measurement of the thsd7a in situ fluorescence signal. Integrated density of fluorescence signal in the region of neural tube was measured using the software, imageJ (NIH). Quantitative data were counted in five random fields (note: we avoided residual fluorescent particles, as indicted by white arrows in A, B) and normalized to the control. Student′s t-test was performed (with two-tailed distribution and unequal variance) in Microsoft Excel to test for differences between two sample populations. A: Representative image of thsd7a expression in the control. B: thsd7a expression in the morphant. C: Relative integrated density of thsd7a in situ fluorescence signal in the control and morphant (**P < 0.01).
Image
Figure Caption
Acknowledgments
This image is the copyrighted work of the attributed author or publisher, and
ZFIN has permission only to display this image to its users.
Additional permissions should be obtained from the applicable author or publisher of the image.
Full text @ Dev. Dyn.

