Image
Figure Caption
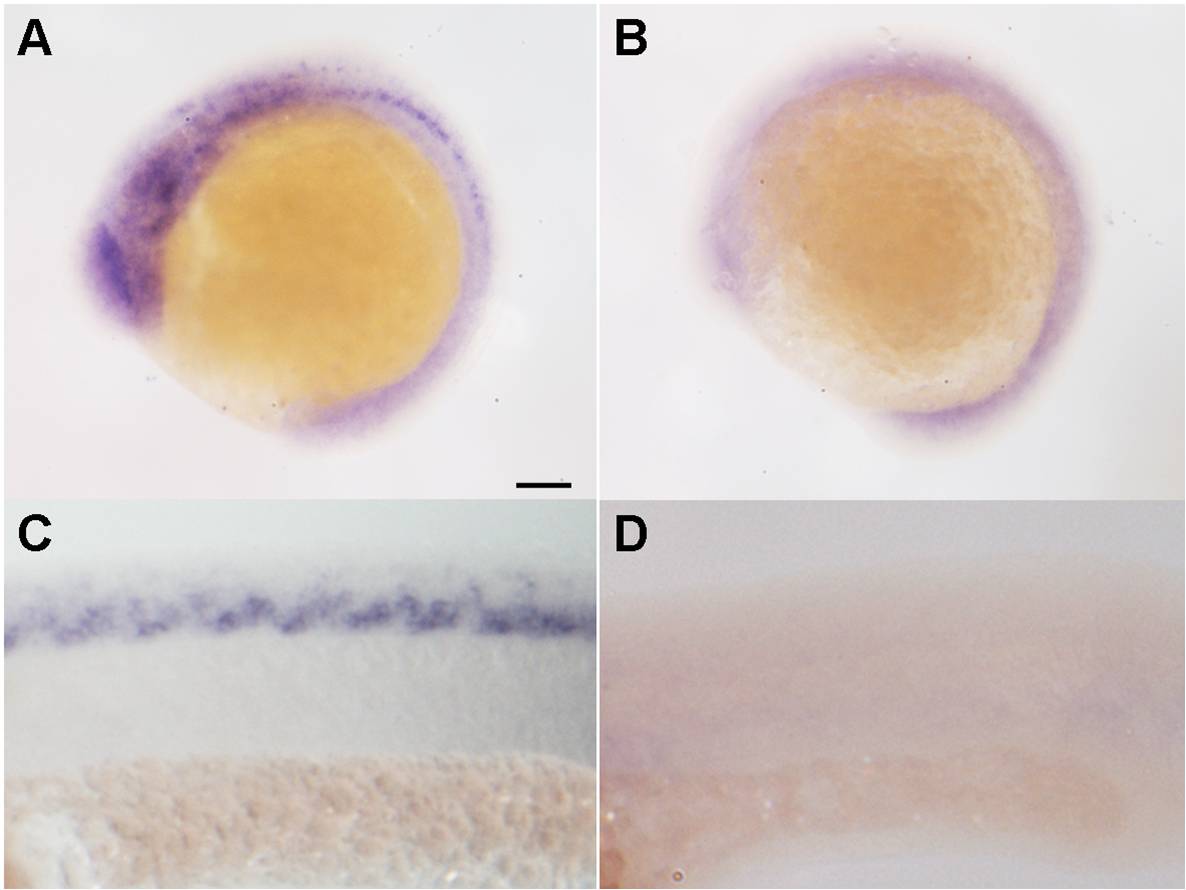
Fig. S2 The thsd7a expression levels increase during embryogenesis. Real-time quantification polymerase chain reaction (RT-qPCR) was performed on zebrafish embryos at different developmental stages. The thsd7a expression level was first normalized by beta-actin expression and then by the level at stage 2.25 hours postfertilization (hpf), and was plotted as mean ± SEM. A small amount of thsd7a transcript was detected at 2.25 hpf. Zygotic thsd7a was up-regulated at 15 hpf and persistently increased during the examined developmental period.
Acknowledgments
This image is the copyrighted work of the attributed author or publisher, and
ZFIN has permission only to display this image to its users.
Additional permissions should be obtained from the applicable author or publisher of the image.
Full text @ Dev. Dyn.

