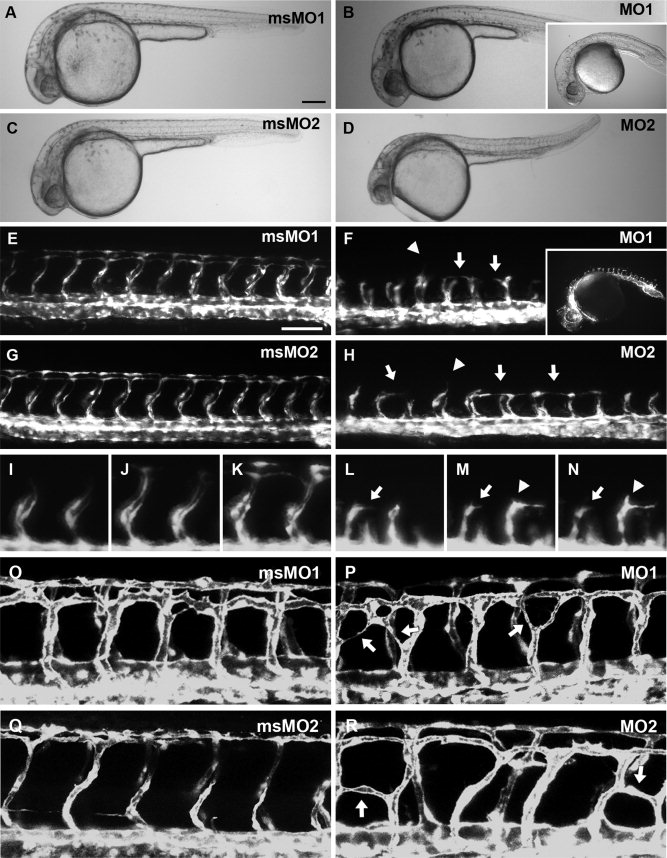
Fig. 4 Knockdown of Thsd7a impairs intersegmental vessel (ISV) angiogenesis. Representative images showed the effect of Thsd7a knockdown on ISV angiogenesis. Anterior is to the left. Embryos were examined at 29?31 hours postfertilization (hpf; A?N), 24?36 hpf (I?N), and 50 hpf (O?R). A,C,E,G: Embryos injected with msMOs. B,D,F,H: Embryos injected with 1 ng of MO1 (B,F; the inset images in panels B and F show a representative embryo injected with 2 ng of MO1) and 9 ng of MO2 (D,H). E,G: Complete ISV networks were formed in embryos injected with msMO1 (E) or msMO2 (G). F,H: Aberrant ISV patterning was observed in embryos injected with MO1 (F) or MO2 (H). Lateral deviation is indicated by white arrows. ISVs that reached the roof of the neural tube are indicated by white arrowheads. I?N: ISV patterning in embryos injected with 1 ng of msMO1 (I?K) or 1 ng of MO1 (L?N) at 24 hpf (I,L), 30 hpf (J,M), and 36 hpf (K,N). White arrows in panels L?N indicate the EC that extended and retracted filopodia. Arrowheads in panels M and N indicate a lamellipodia-like structural extension. O?R: Representative images of ISV network in the control siblings (O, Q; 1 ng of msMO1 and 18 ng of msMO2) and the morphants (P, R; 1 ng of MO1 and 18 ng of MO2) at 50 hpf. Abnormal ISV branches are indicated by white arrows. Scale bars = 200 μm in A; 100 μm in E.
Image
Figure Caption
Figure Data
Acknowledgments
This image is the copyrighted work of the attributed author or publisher, and
ZFIN has permission only to display this image to its users.
Additional permissions should be obtained from the applicable author or publisher of the image.
Full text @ Dev. Dyn.

