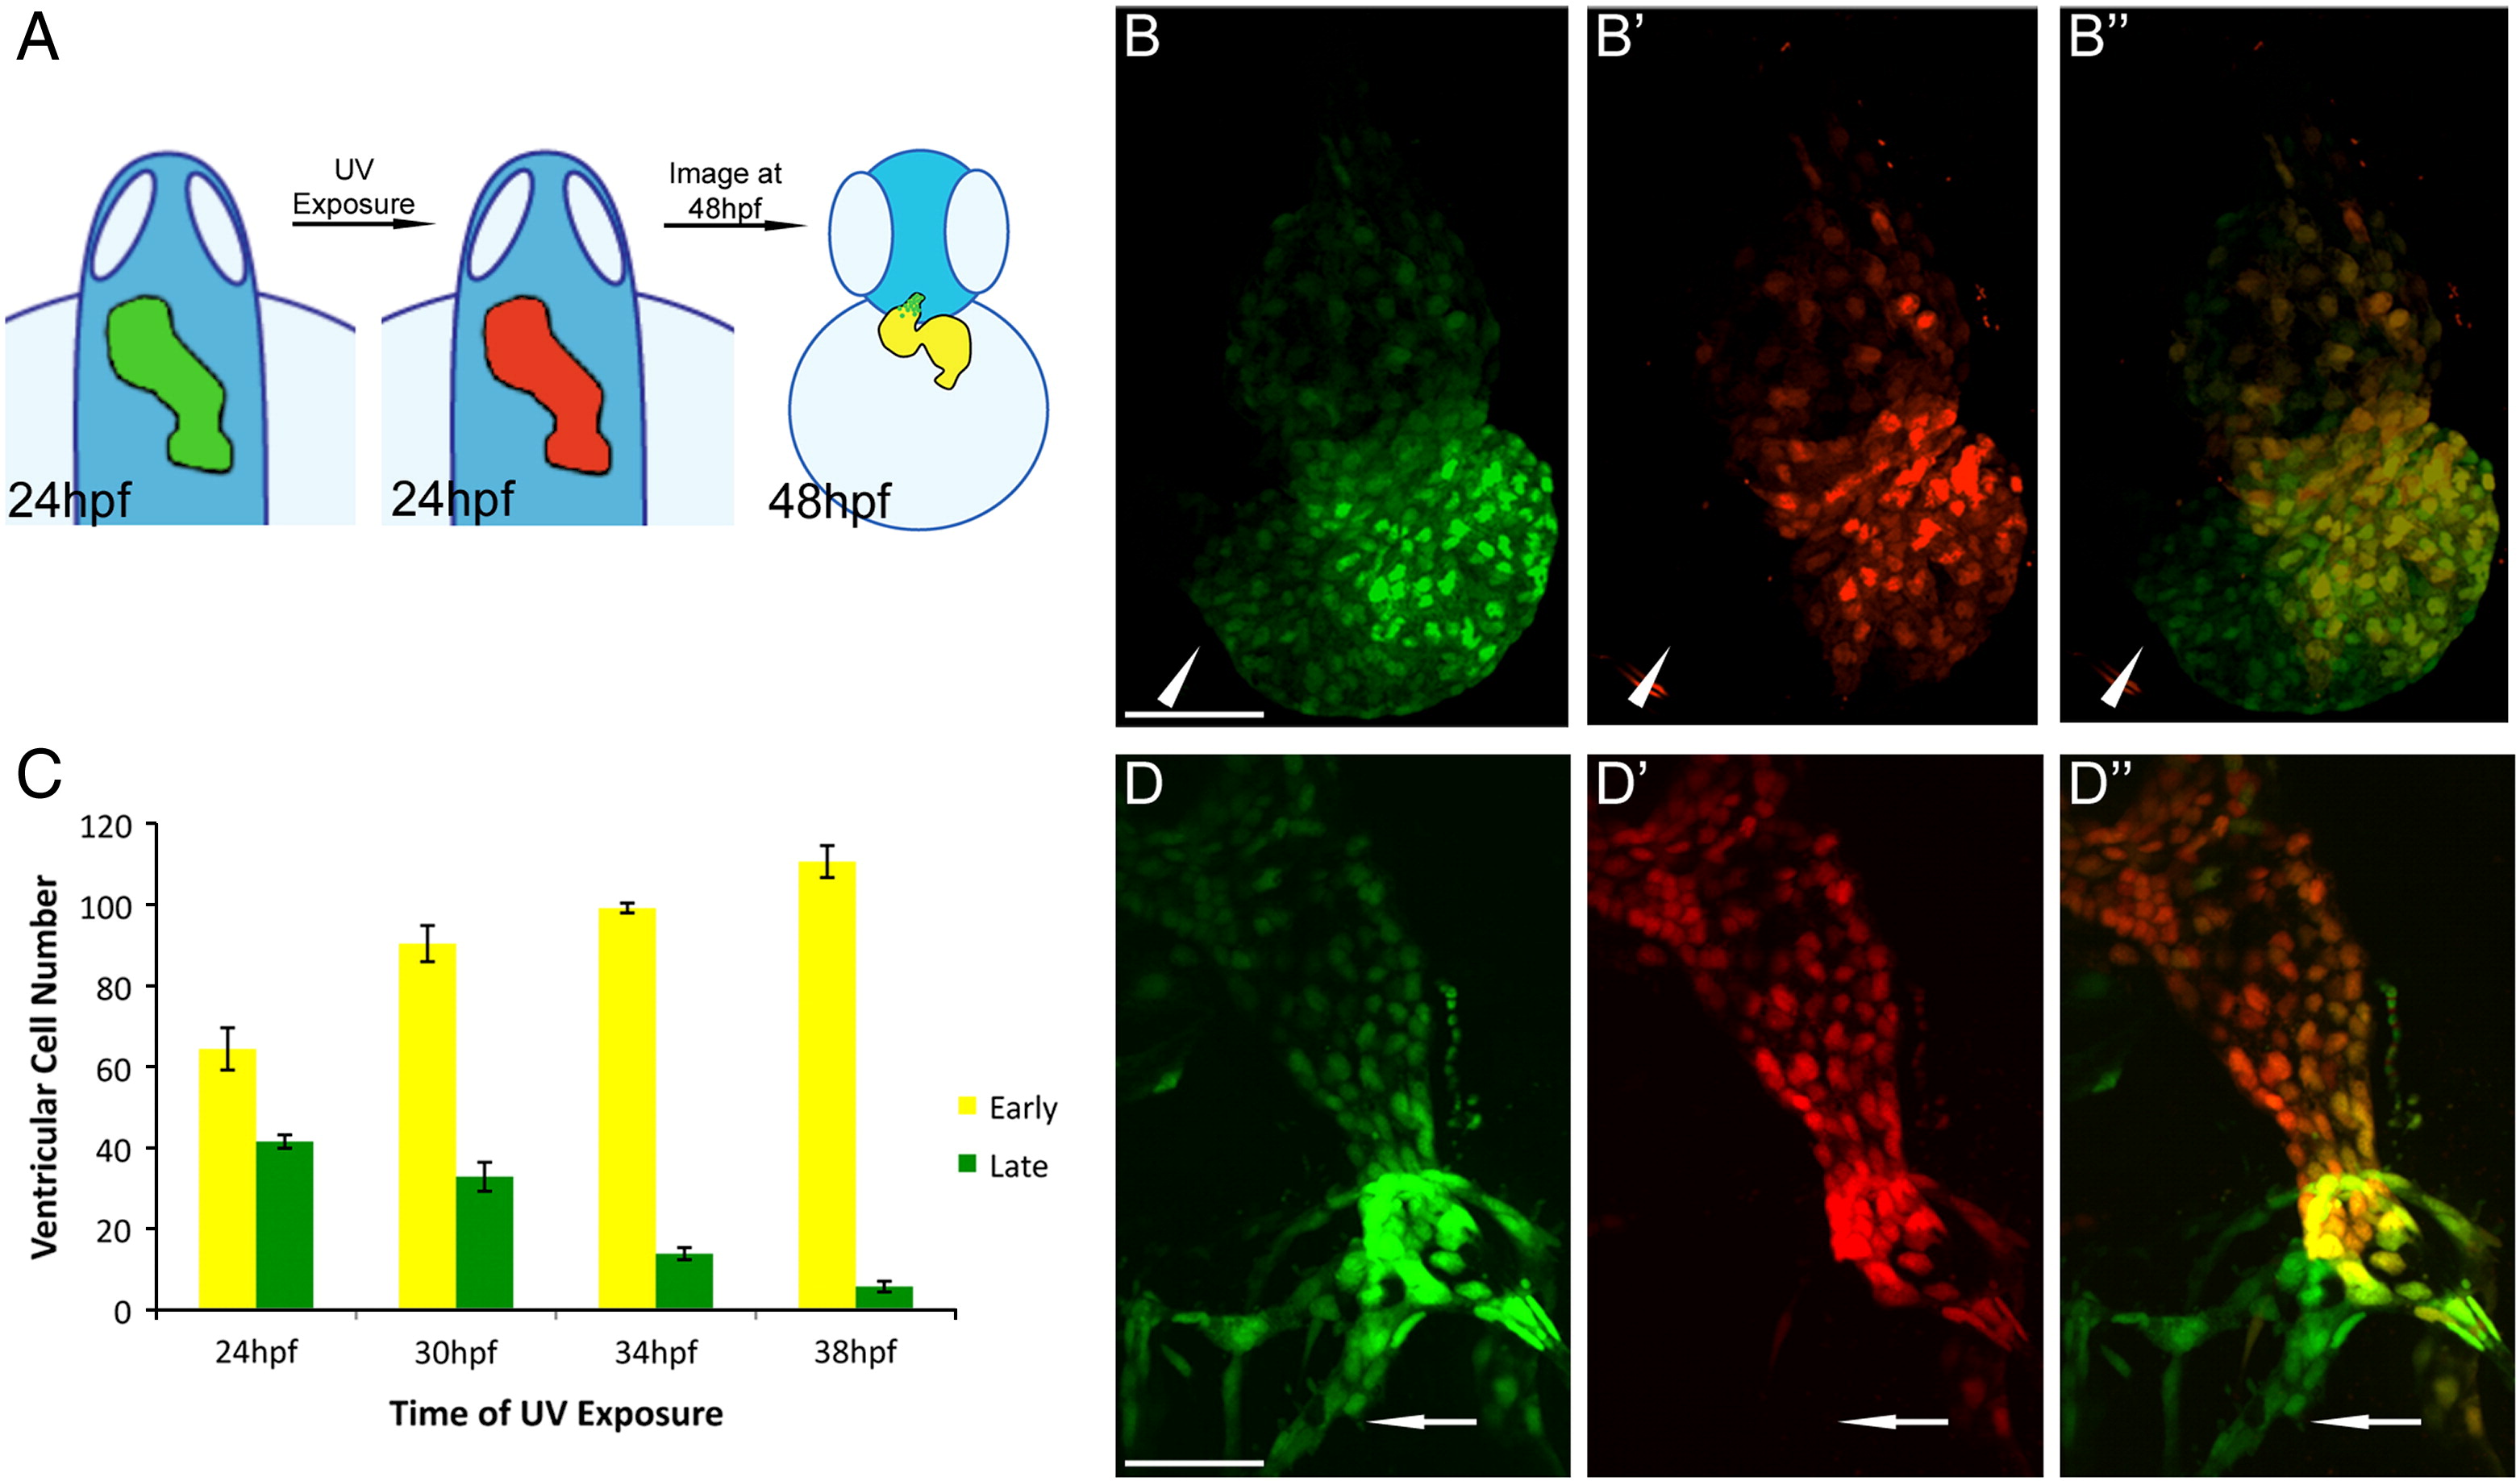
Fig. 1 Photoconversion assay showed late myocardial addition to the arterial pole. (A). Schematic representation of myl7:nlsKikGR photoconversion assay. Hearts were exposed to UV light at 24 hpf (and later time points), permanently photoconverting nlsKikGR to a red fluorescent version and marking differentiated myocardial cells. At 48 hpf, myocardial cells marked by red fluorescence additionally expressed newly synthesized green fluorescing nlsKikGR (yellow in overlay), while new myocardial cells only expressed green fluorescing nlsKikGR. (B?B′′) Representative image of a heart photoconverted at 24 hpf and imaged at 48 hpf. White arrowhead indicates a population of green-only cells (B and B′′) that were not marked by red fluorescence (B′). (C) Cell counting of early and late ventricular myocardial nuclei. Hearts were exposed to progressively later UV exposures and imaged at 48 hpf. Number of green-only cells observed decreased with later UV exposure, whereas yellow cell numbers increased. Data is shown as mean ± SEM (D?D′′) Representative image of kdrl:nlsKikGR line, marking endothelial cells. UV photoconversion at 28 hpf and imaging at 48 hpf showed a population of green-only endothelial cells (compare D to D′, white arrow) at the arterial pole (D′′). Green channel (B and D), red channel (B′ and D′), and overlay (B′′ and D′′). Scale bar represents 50 μm.
Reprinted from Developmental Biology, 354(1), Lazic, S., and Scott, I.C., Mef2cb regulates late myocardial cell addition from a second heart field-like population of progenitors in zebrafish, 123-133, Copyright (2011) with permission from Elsevier. Full text @ Dev. Biol.

