
Image
|
Figure Caption
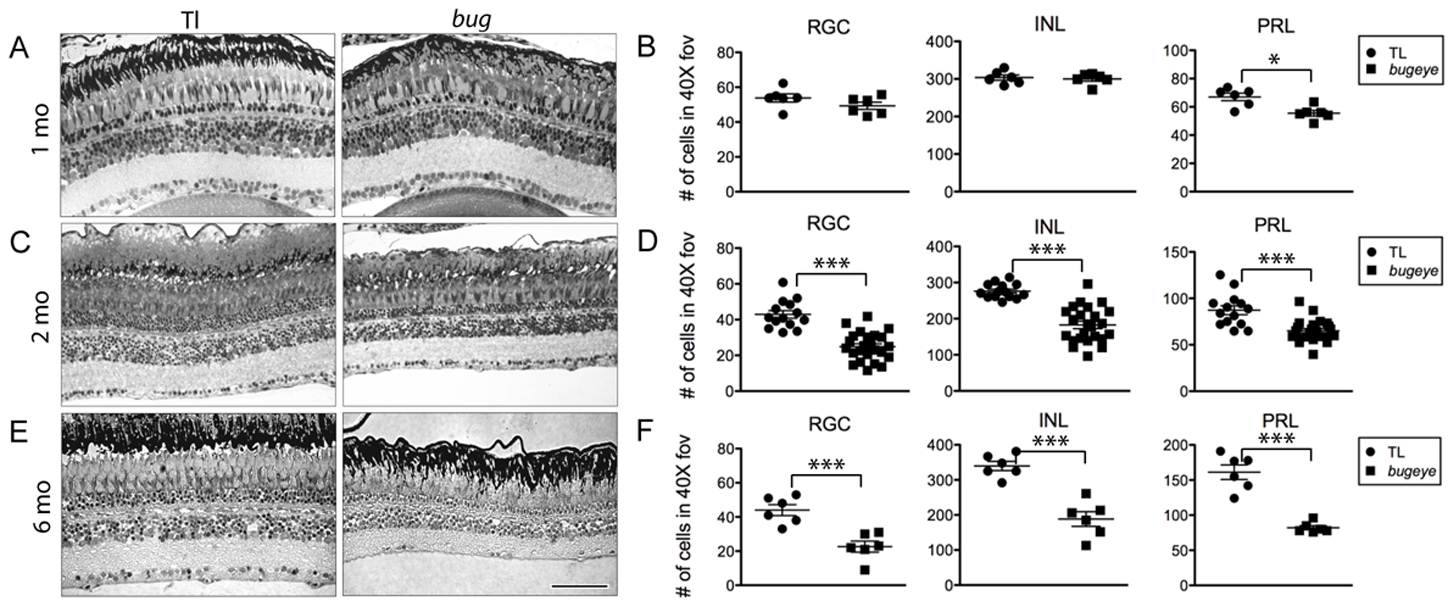
Fig. 4
Retinal cell density.
Semi-thin plastic sections of the central retina, with associated quantification of cell density in each neural layer at 1 (A?B), 2 (C?D), and 6 (E?F) months in TL and bugeye. Scale bar A?E = 50 μm. *p<0.05, ***p<0.001, t-test; FOV, field of view.
Figure Data
Acknowledgments
This image is the copyrighted work of the attributed author or publisher, and
ZFIN has permission only to display this image to its users.
Additional permissions should be obtained from the applicable author or publisher of the image.
Full text @ PLoS Genet.