
|
Fig. s1
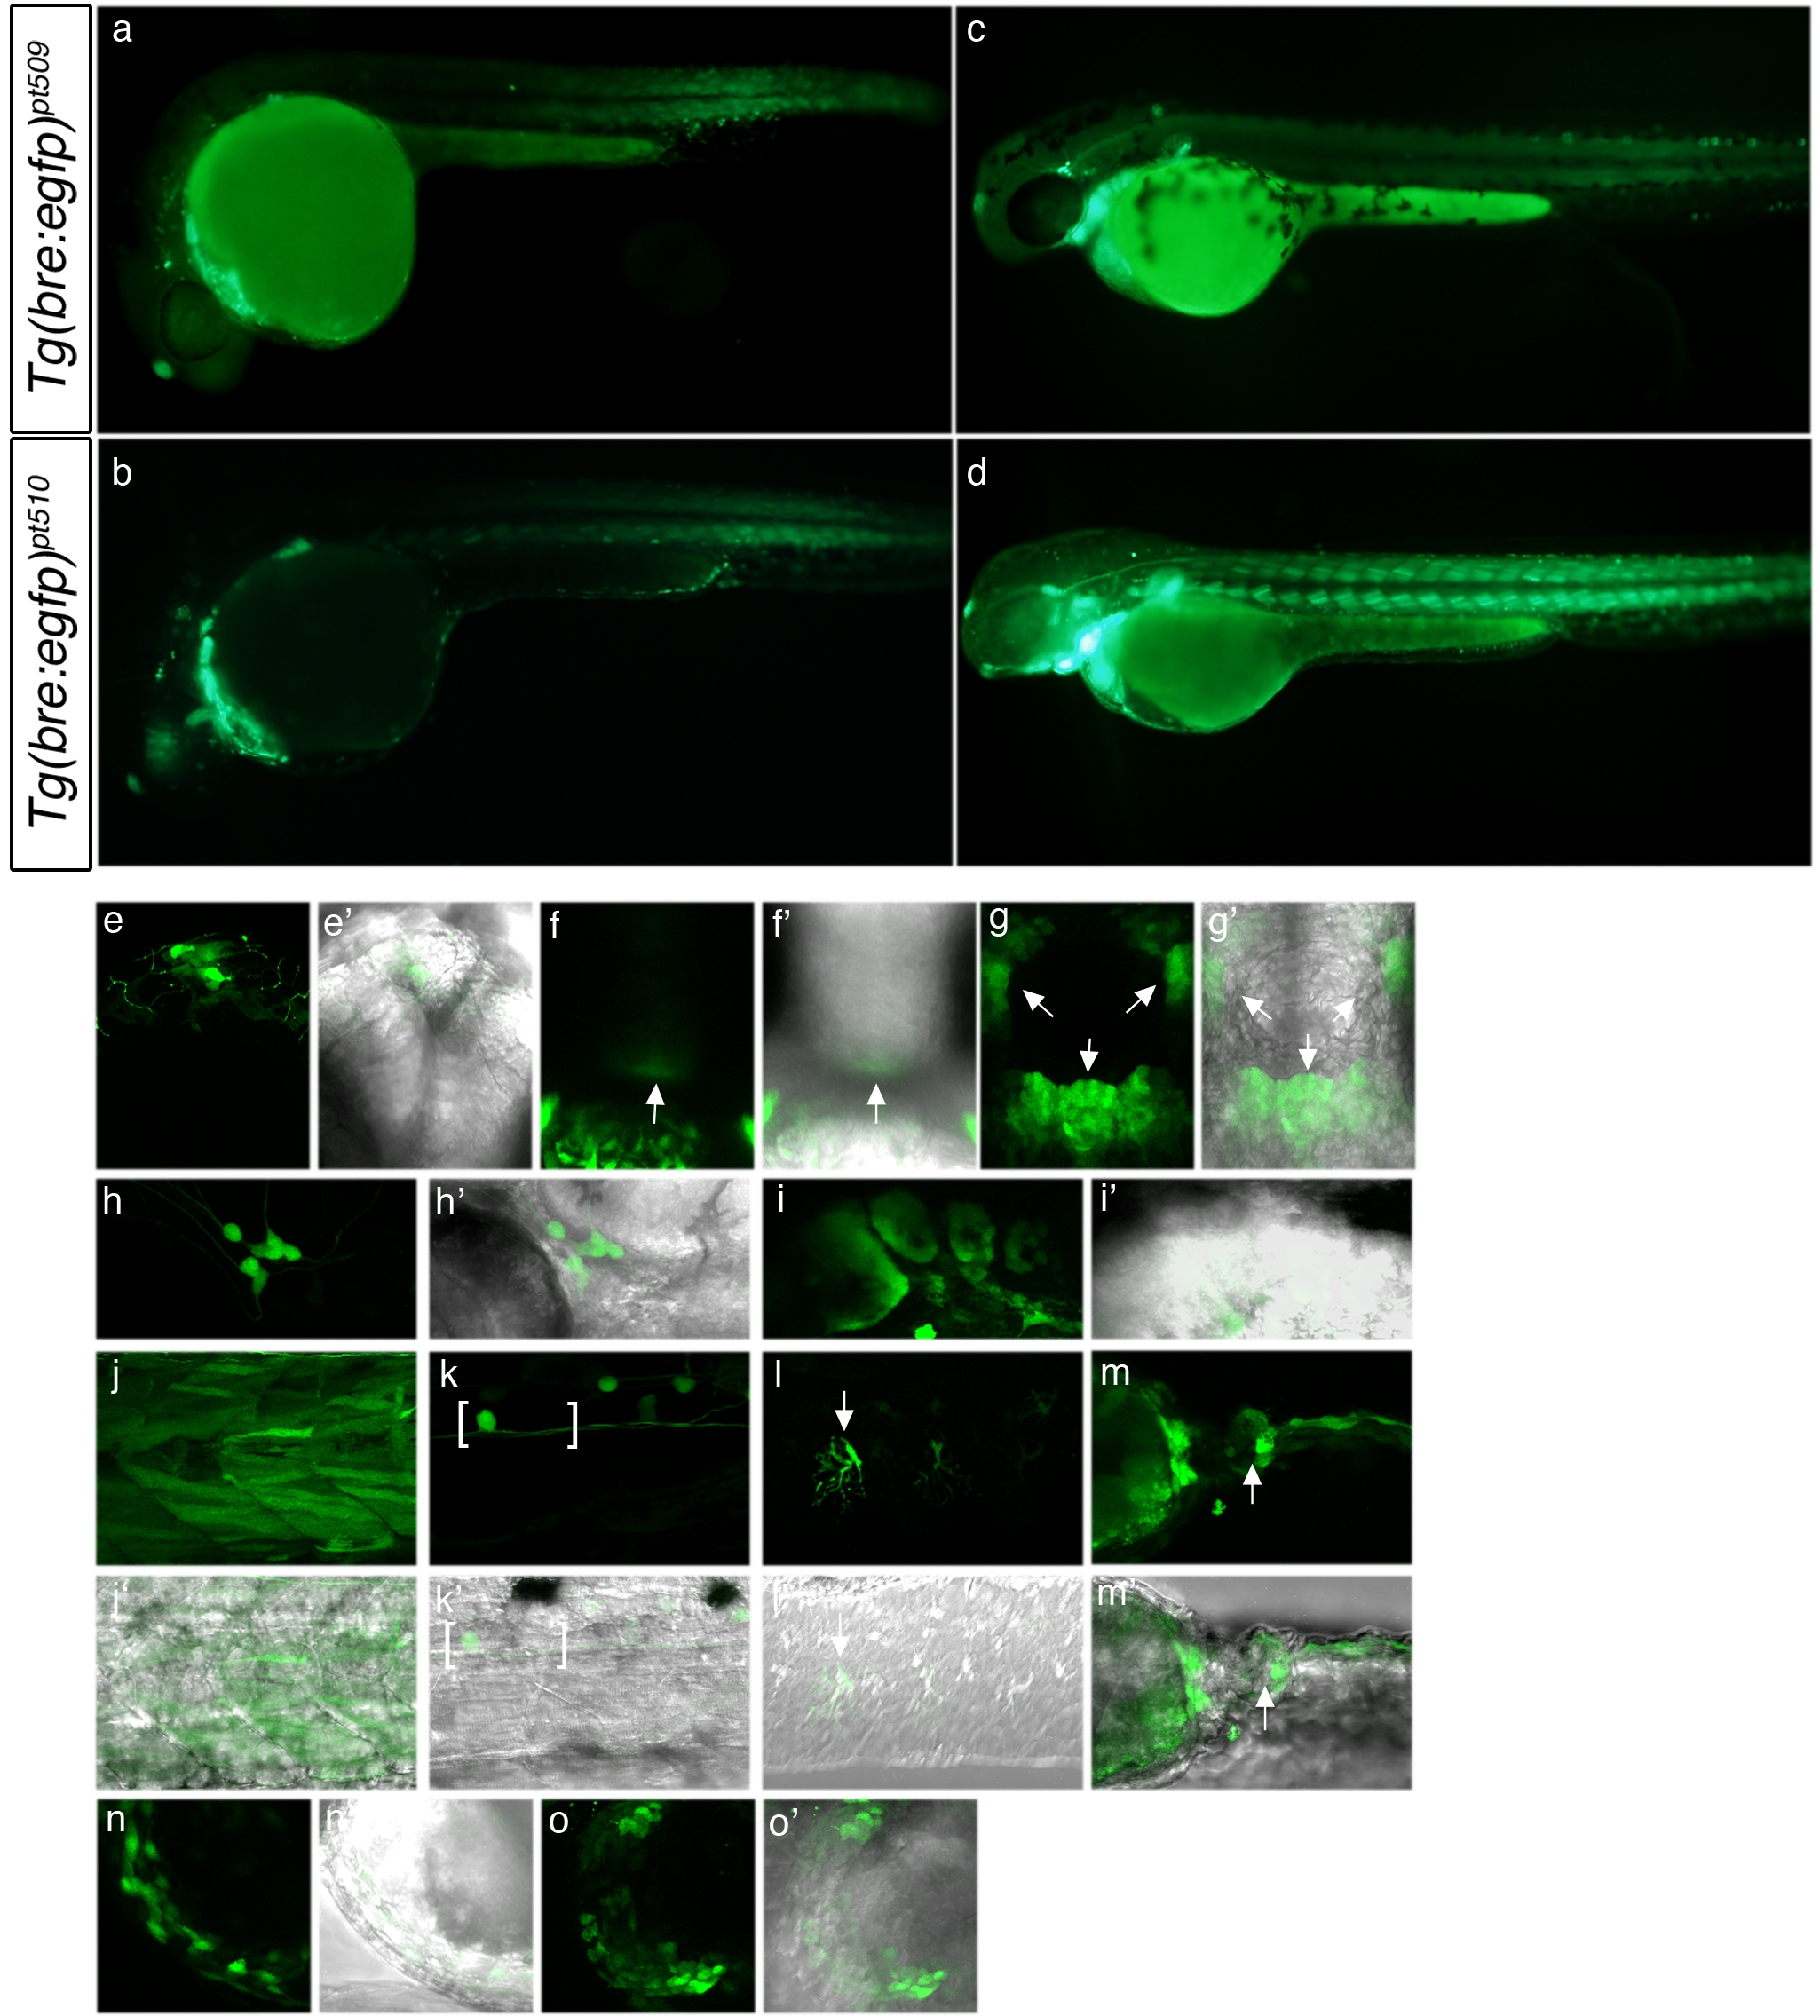
Supporting Information Figure 1. Developmental profile of pSmad1/5/8-mediated transcriptional activity in Tg(bre:egfp)pt509 embryos. In all images, green indicates bre-driven EGFP expression. a?d: Macro images of Tg(bre:egfp)pt509 (a, c) and Tg(bre:egfp)pt510 (b, d) at 1 dpf (a, b) and 2 dpf (c, d). e?o: 2D projections of confocal Z-series, Tg(bre:egfp)pt509. Magnification, 400�. e, e2: Pineal gland, 1 dpf. f, f2: Hypothalamus, 1 dpf. g, g2: Stomodeum, 2 dpf. h, h2: Trigeminal ganglia, 1 dpf. i, i2: Pharyngeal arches, 1 dpf. j, j2: Somites, 1 dpf. k, k2: Spinal cord neurons, 2 dpf. Brackets denote spinal cord. l, l2: Mesenchymal cells of the median finfold, 2 dpf. m, m2: Cloaca, 1 dpf. n, n2: Heart, 1dpf. o, o2: Pectoral fin, 2 dpf. a?d, h?l, n, o: Lateral view, anterior left. e, f: Frontal view, left to the right. g: Ventral view, anterior up. m: Ventral view, anterior left.