
|
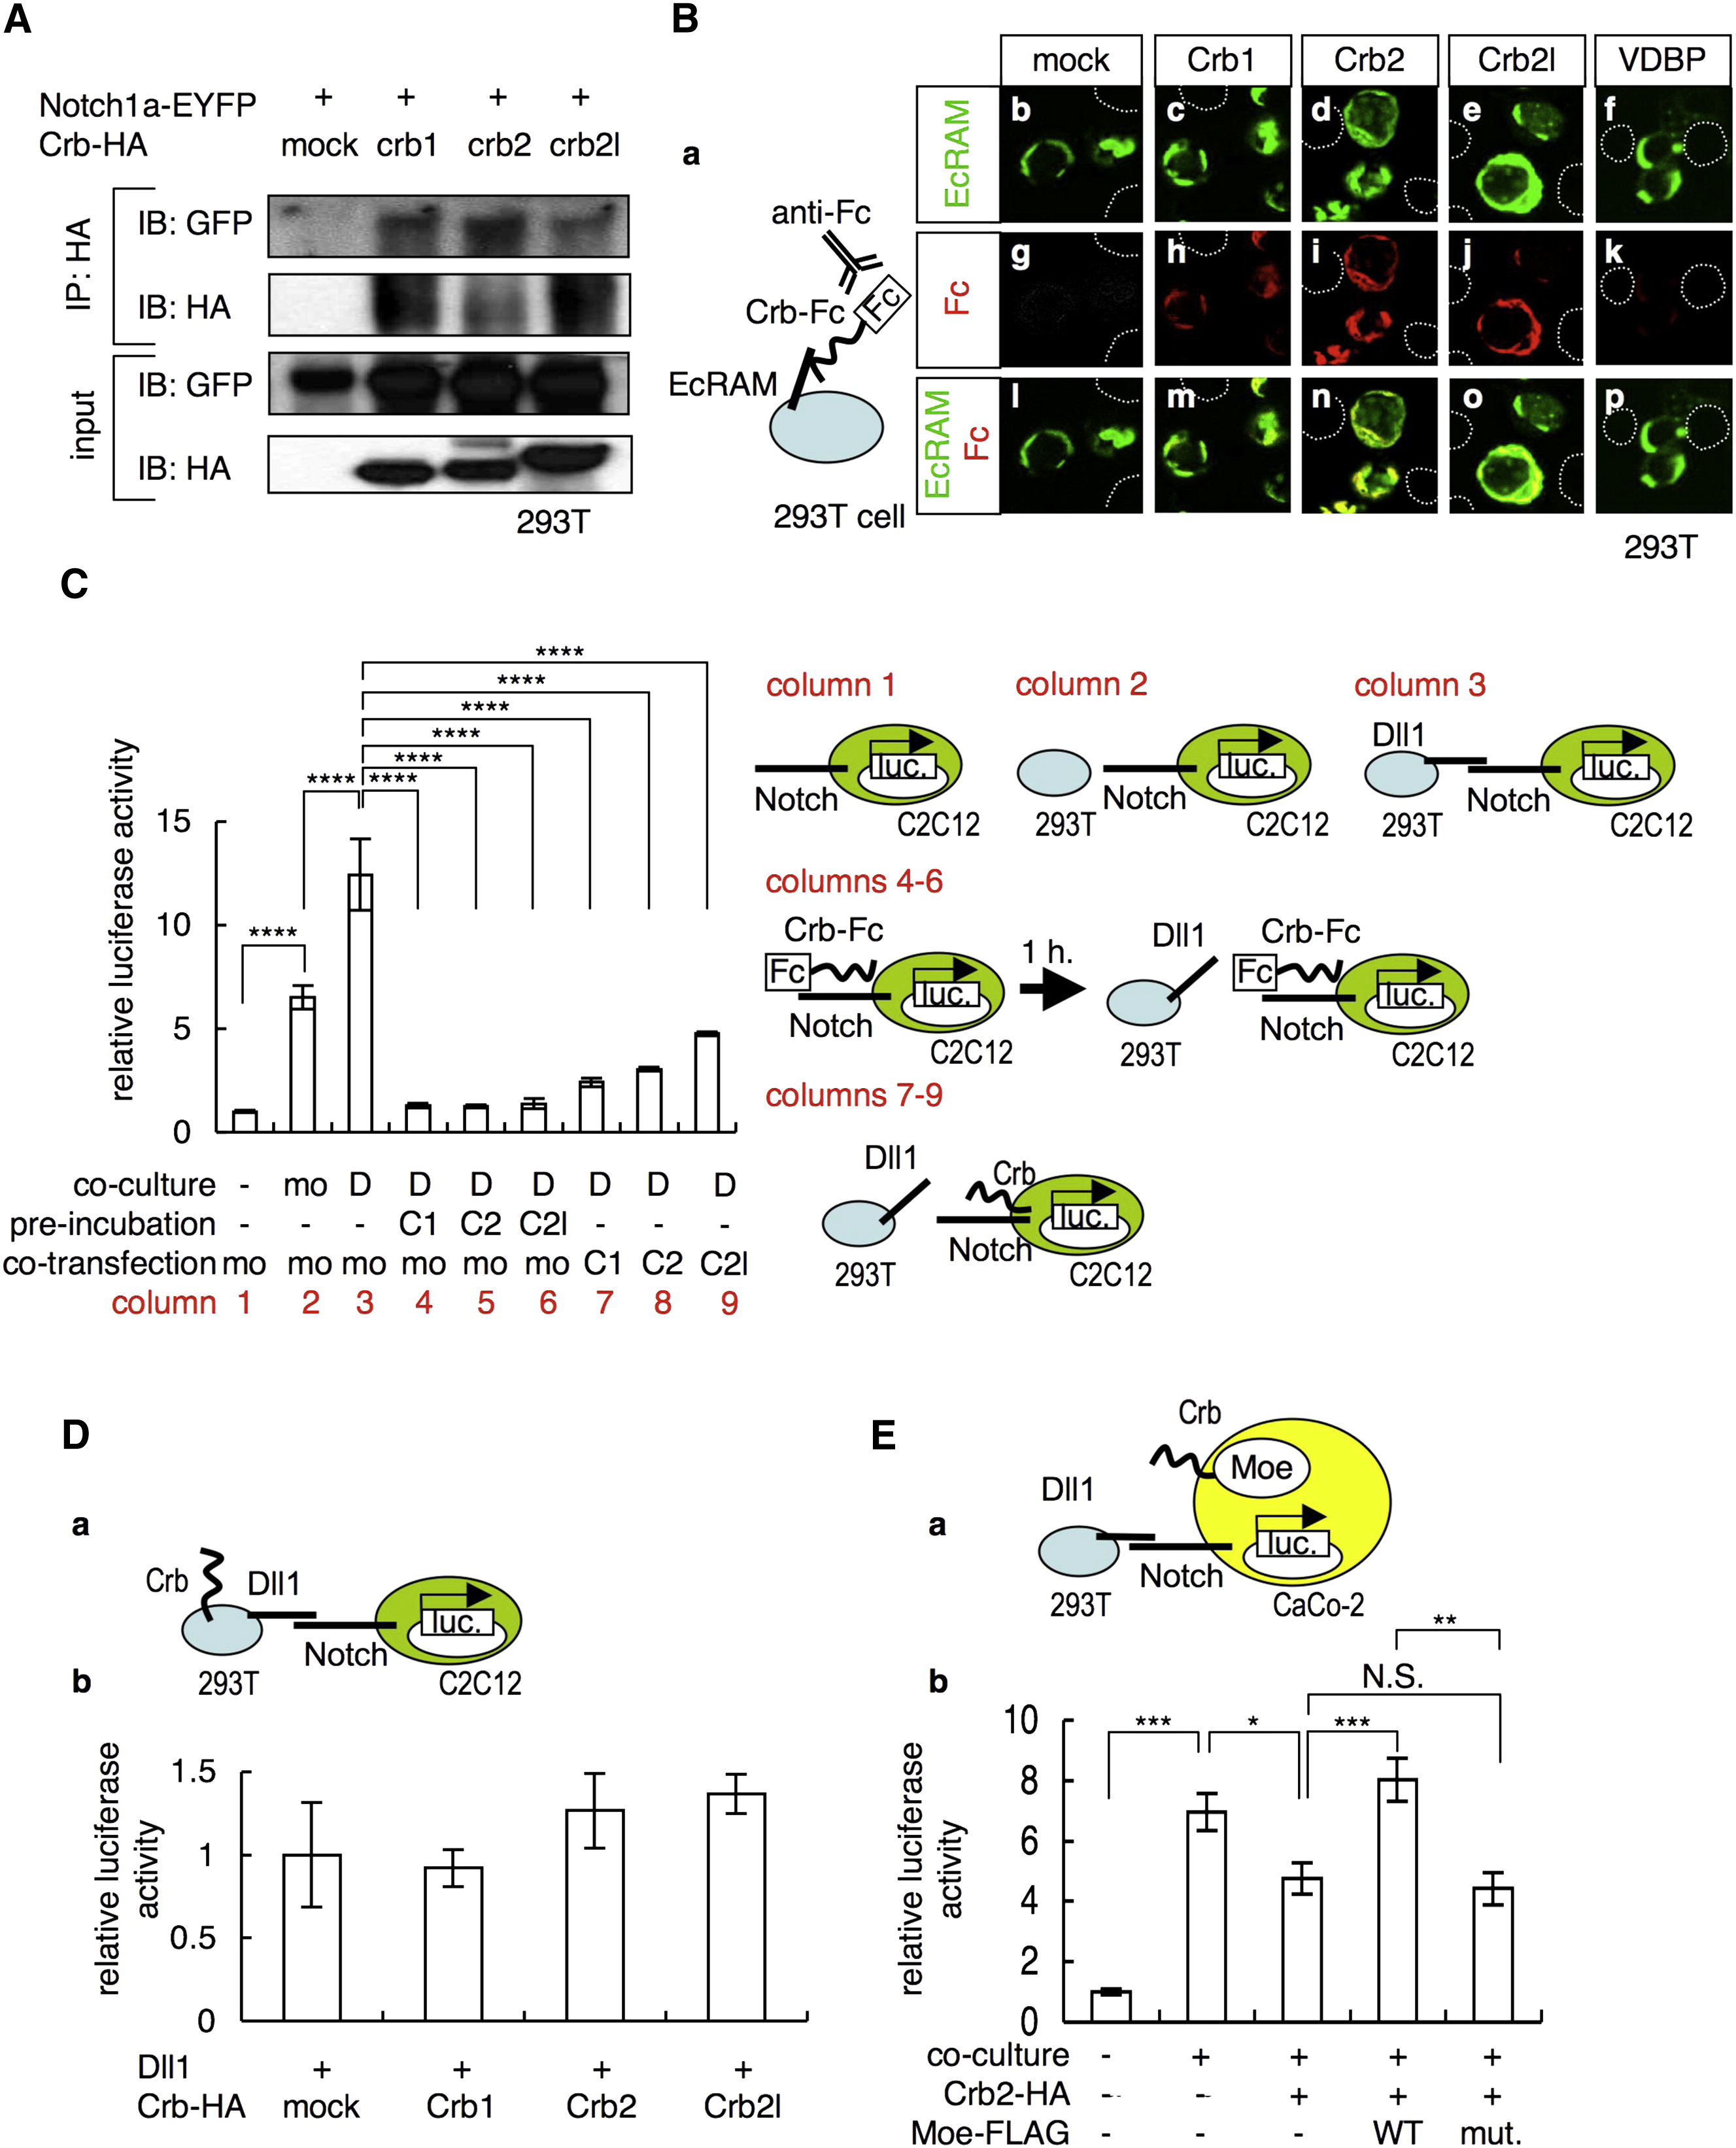
Fig. 5 Crb Interacts with the Extracellular Domain of Notch and Inhibits Notch Activity
(A) Coimmunoprecipitation of Notch1a-EYFP with Crb1-HA, Crb2-HA, and Crb2l-HA.
(B) (a) Schematic of the cell-surface binding assay. 293T cells that overexpressed EcRAM-EYFP (b?f) were incubated with conditioned media prepared from cultures of 293T cells that were transfected with the mock plasmid (g) or with plasmids that encode the Crb1-Fc (h), Crb2-Fc (i), Crb2l-Fc (j), and VDBP-Fc (k) proteins. Merged images of the signals from EcRAM-EYFP (green) and Crb-Fc (red) are shown in (l?p). The dotted lines in (b?p) indicate EcRAM-EYFP-nonexpressing cells.
(C) Notch-luciferase reporter assay (left) and schematic of this assay (right). C2C12 cells that were transfected with the Notch-luciferase reporter construct were cultured alone (column 1) or cocultured with 293T cells that were transfected with a mock vector (column 2, mo is an abbreviation for mock) or the Dll1-expressing vector (column 3, D). C2C12 cells transfected with the Notch-luciferase reporter construct were incubated with the conditioned media that contained the Crb1-Fc (column 4, C1), Crb2-Fc (column 5, C2), and Crb2l-Fc (column 6, C2l) proteins, before coculturing with the Dll1-expressing 293T cells. C2C12 cells were transfected with the Notch-luciferase reporter construct together with the mock (column 3, mo), Crb1-HA (column 7, C1), Crb2-HA (column 8, C2), and Crb2l-HA (column 9, C2l) vectors. The data shown are mean ± SEM; ****p < 0.001.
(D) (a) Schematic of the luciferase reporter assay depicted in (b). C2C12 cells transfected with Notch-luciferase reporter construct were cocultured with 293T cells that were transfected with the Dll1-expressing vector together with the mock, Crb1-HA (Crb1), Crb2-HA (Crb2), and Crb2l-HA (Crb2l) vectors. The data shown are mean ± SEM.
(E) (a) Schematic of the luciferase reporter assay shown in (b). CaCo-2 cells transfected with the Notch-luciferase reporter construct, Crb2-HA, WT Moe-FLAG (WT), and L221R-type Moe-FLAG (mut.) vectors were either cultured alone or cocultured with Dll1-overexpressing 293T cells. The data shown are mean ± SEM; *p < 0.05; **p < 0.01; ***p < 0.005.