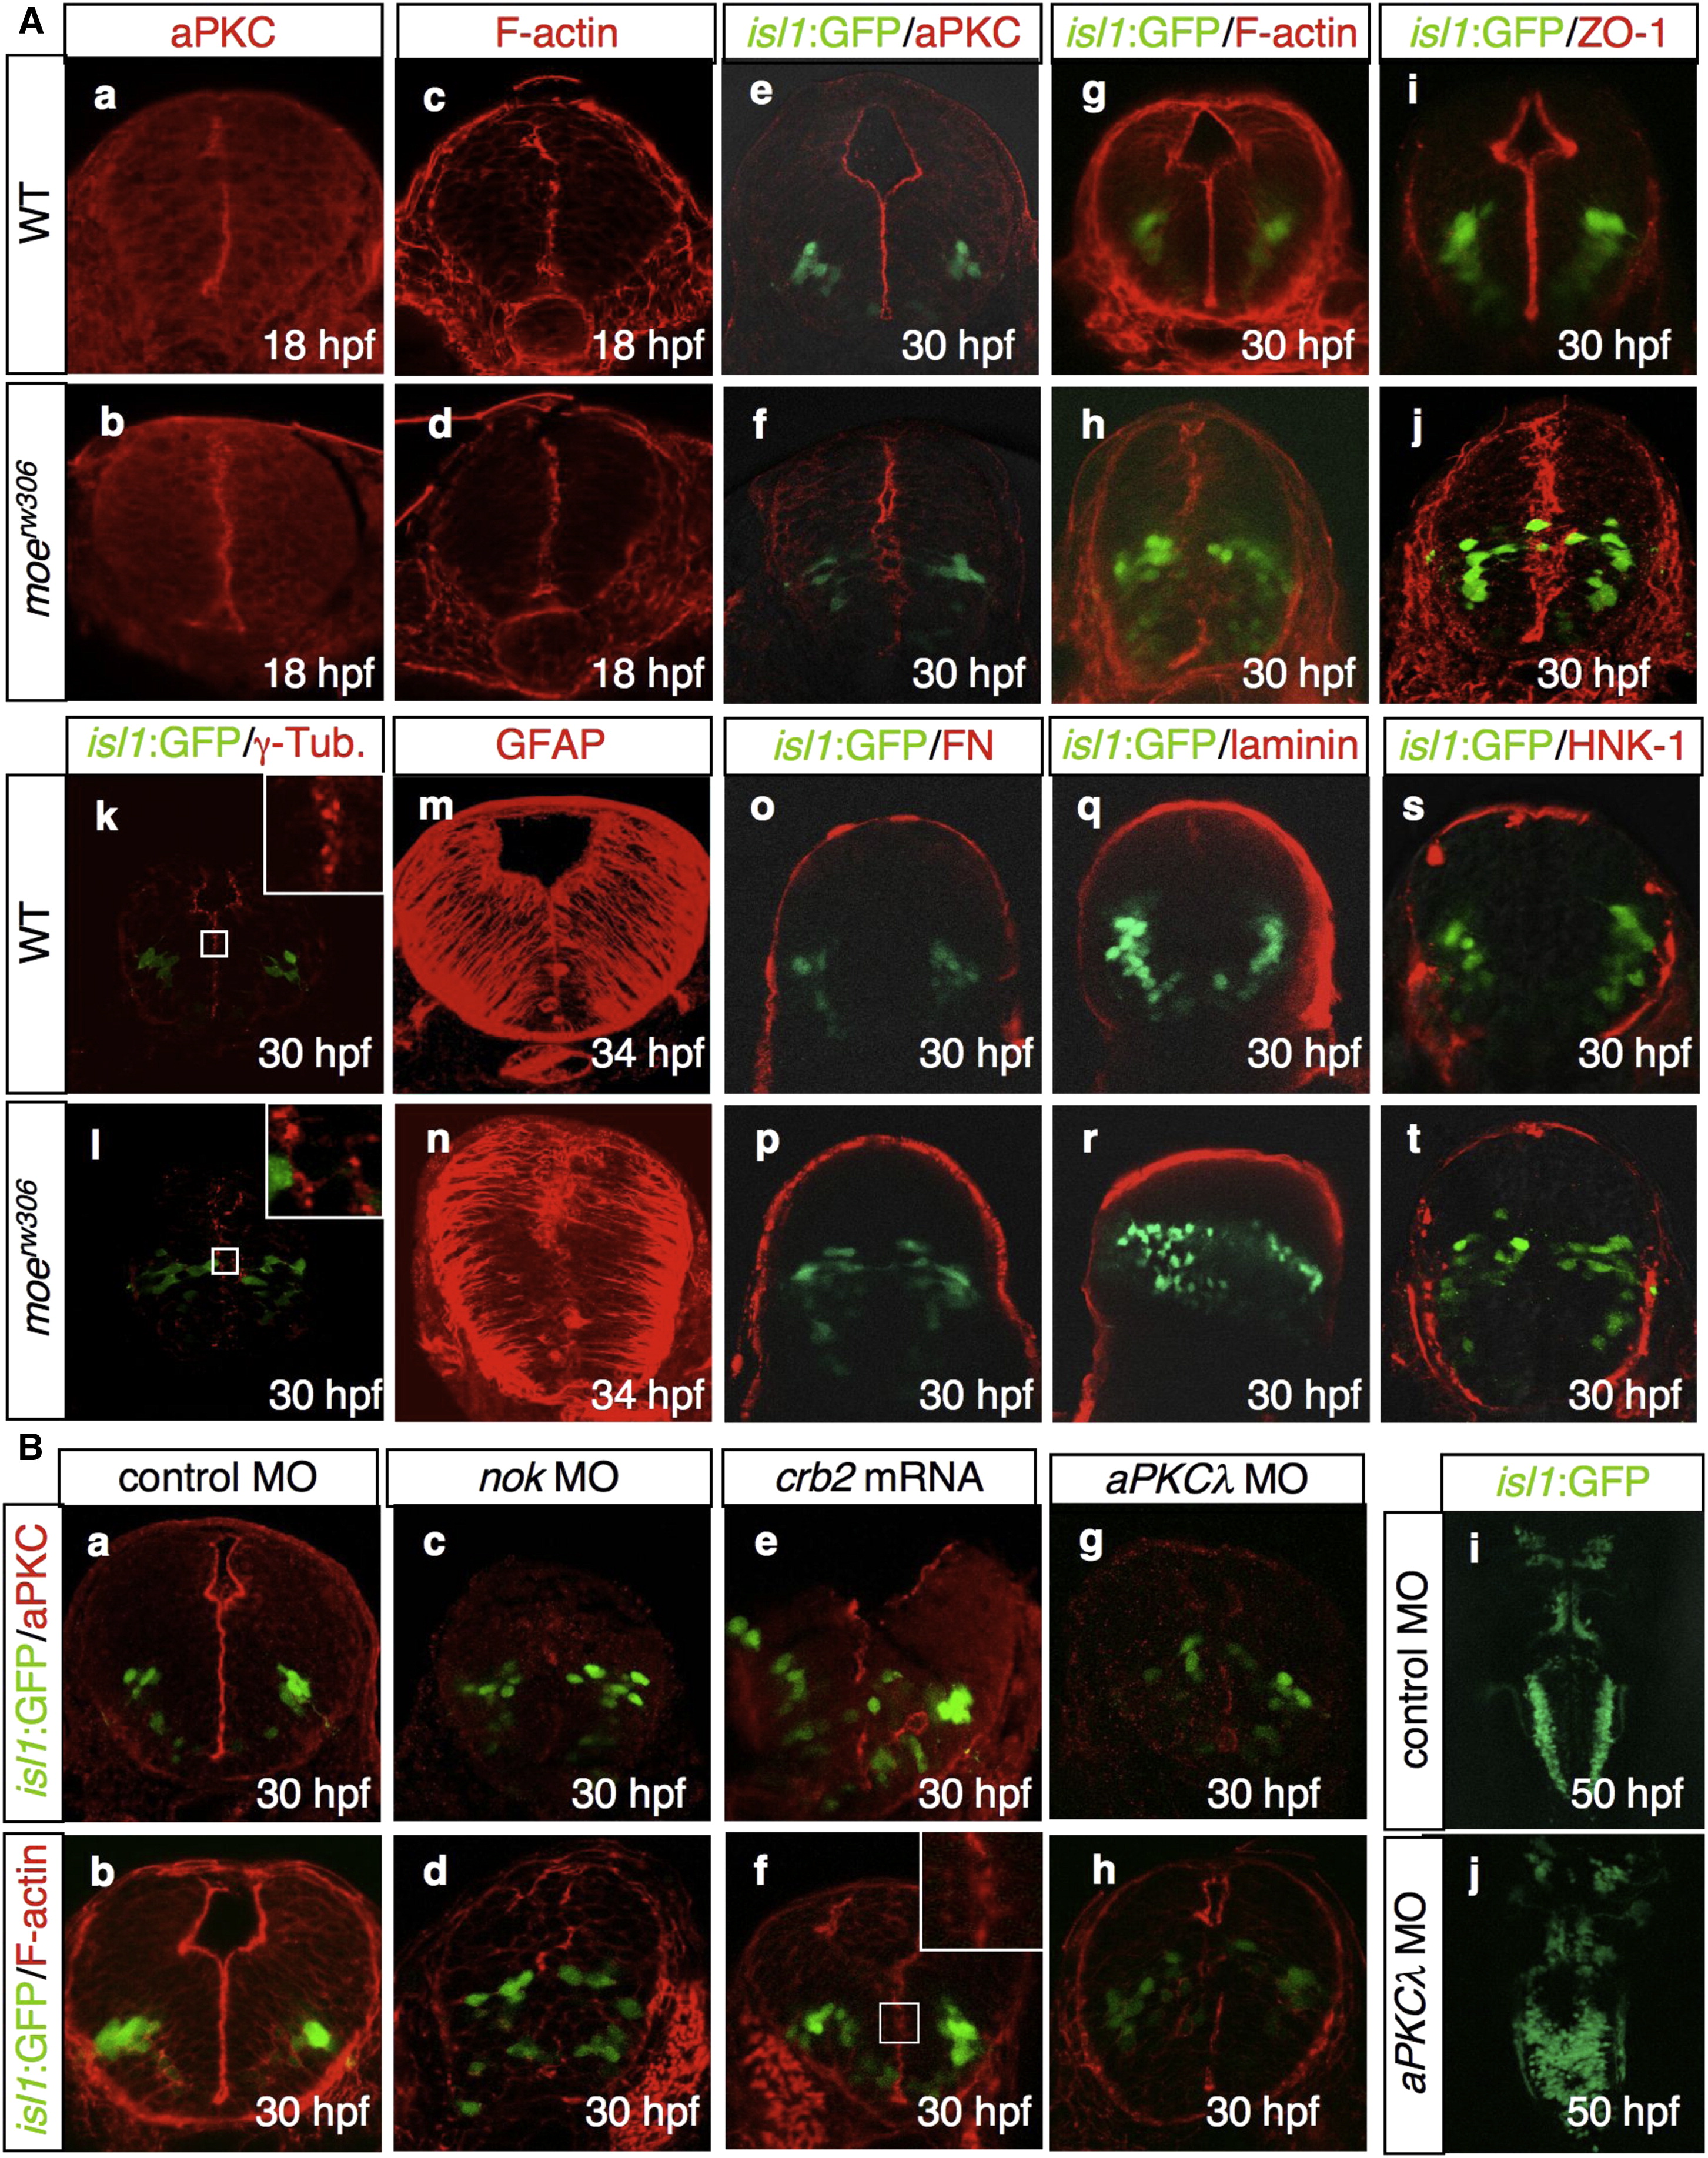
Fig. 3 The moerw306 Mutation Affects Neuroepithelial Polarity
(A) Visualization of aPKC (a and b; 18 hpf; e and f; 30 hpf; red), F-actin (c and d; 18 hpf; g and h; 30 hpf; red), ZO-1 (i and j; 30 hpf, red), γ-tubulin (γ-Tub; k and l; 30 hpf, red), GFAP (m and n; 34 hpf, red), fibronectin (FN; o and p; 30 hpf, red), laminin (q and r; 30 hpf, red), and HNK-1 antigen (s and t; 30 hpf, red) in the WT (a, c, e, g, i, k, m, o, q, and s) and moerw306 mutant (b, d, f, h, j, l, n, p, r, and t) embryos. The vagus motor neurons are apparent in green (e?l, o?t). Cross-sectional views, dorsal to the top.
(B) Visualization of aPKC (a, c, e, and g; 30 hpf, red) and F-actin (b, d, f, and h; 30 hpf, red) in embryos injected with 5-mis-pair control MO (a and b; 2.5 mg/ml), nok MO (c and d; 2.5 mg/ml), crb2 mRNA (e and f; 500 μg/ml), and aPKCλ MO (g and h; 1.0 mg/ml). The vagus motor neurons are apparent in green. Cross-sectional views, dorsal to the top. (i and j) Dorsal views of isl1:GFP embryos injected with the standard control MO (i; 1.0 mg/ml) and aPKCλ MO (j; 1.0 mg/ml) at 50 hpf (rostral to the top).

