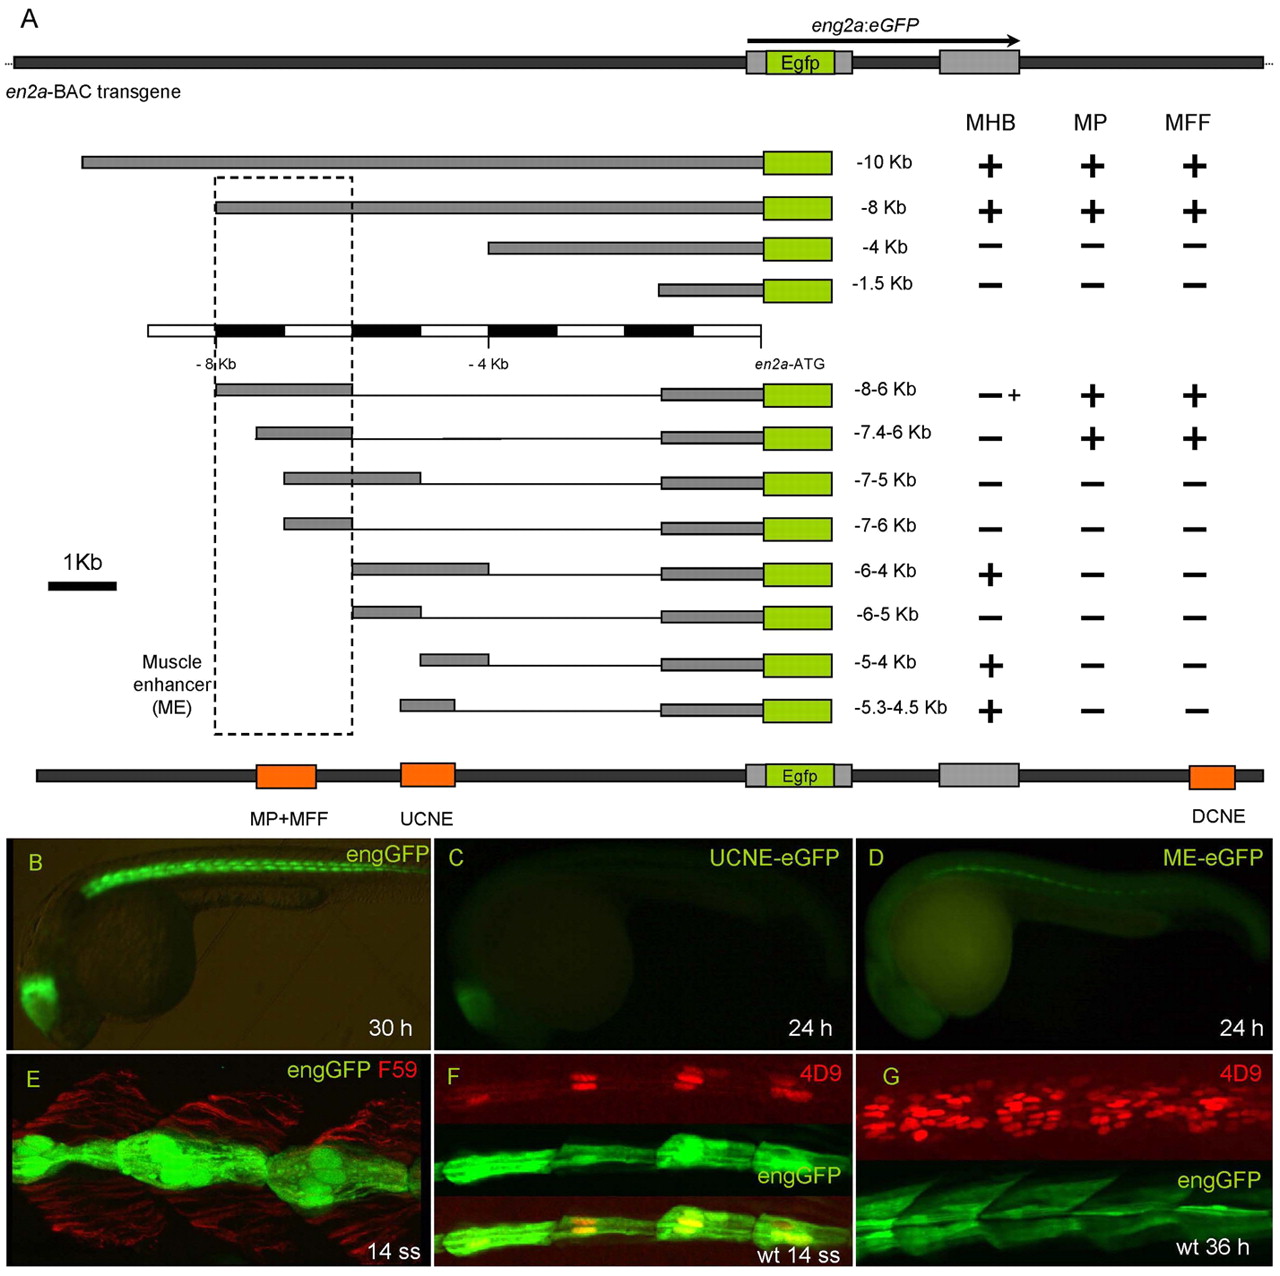
Fig. 1 Identification of cis-regulatory elements in the zebrafish eng2a gene. (A) Schematic representation of the eng2a:eGFP BAC transgene, its deletion derivatives and the enhancers that they identify; the activity of each construct in the MHB, MP cells and MFF is indicated by a + or - sign (+ indicates low-level expression). The dotted box indicates the limits of the 2 kb fragment referred to throughout as the ME. (B-D) Whole-mount lateral views (anterior to left, dorsal up) of: a 30 hour Tg(eng2a:eGFP)i233 embryo showing eGFP expression in the MHB and MP/MFF population (B); a 30 hour Tg(eng2a:eGFP)i243 embryo showing eGFP expression restricted to the MHB (C); a 30 hour Tg(eng2a:eGFP)i236 embryo showing eGFP expression restricted to the MP/MFF population (D). Note that in D the levels of eGFP expression are relatively low, such that only the MP expression is clearly visible at low magnification. (E) Parasagittal optical section of anterior trunk region of a 14 ss Tg(eng2a:eGFP)i233 embryo showing myotomal expression restricted to a subset of the slow fibres revealed by staining with the mAb F59 antibody. (F,G) Similar preparations of F, a 14 ss Tg(eng2a:eGFP)i233 embryo stained with mAb 4D9 showing coincidence of expression (lower merged image) of the transgene (middle image) and the endogenous Eng proteins (upper image), and G, a 36 hour Tg(eng2a:eGFP)i233 stained with mAb 4D9; the transgene is now expressed in both MPs and multinucleate MFFs. UCNE/DCNE: upstream/downstream conserved non-coding element (conserved from fish to mammals).
Image
Figure Caption
Figure Data
Acknowledgments
This image is the copyrighted work of the attributed author or publisher, and
ZFIN has permission only to display this image to its users.
Additional permissions should be obtained from the applicable author or publisher of the image.
Full text @ Development

