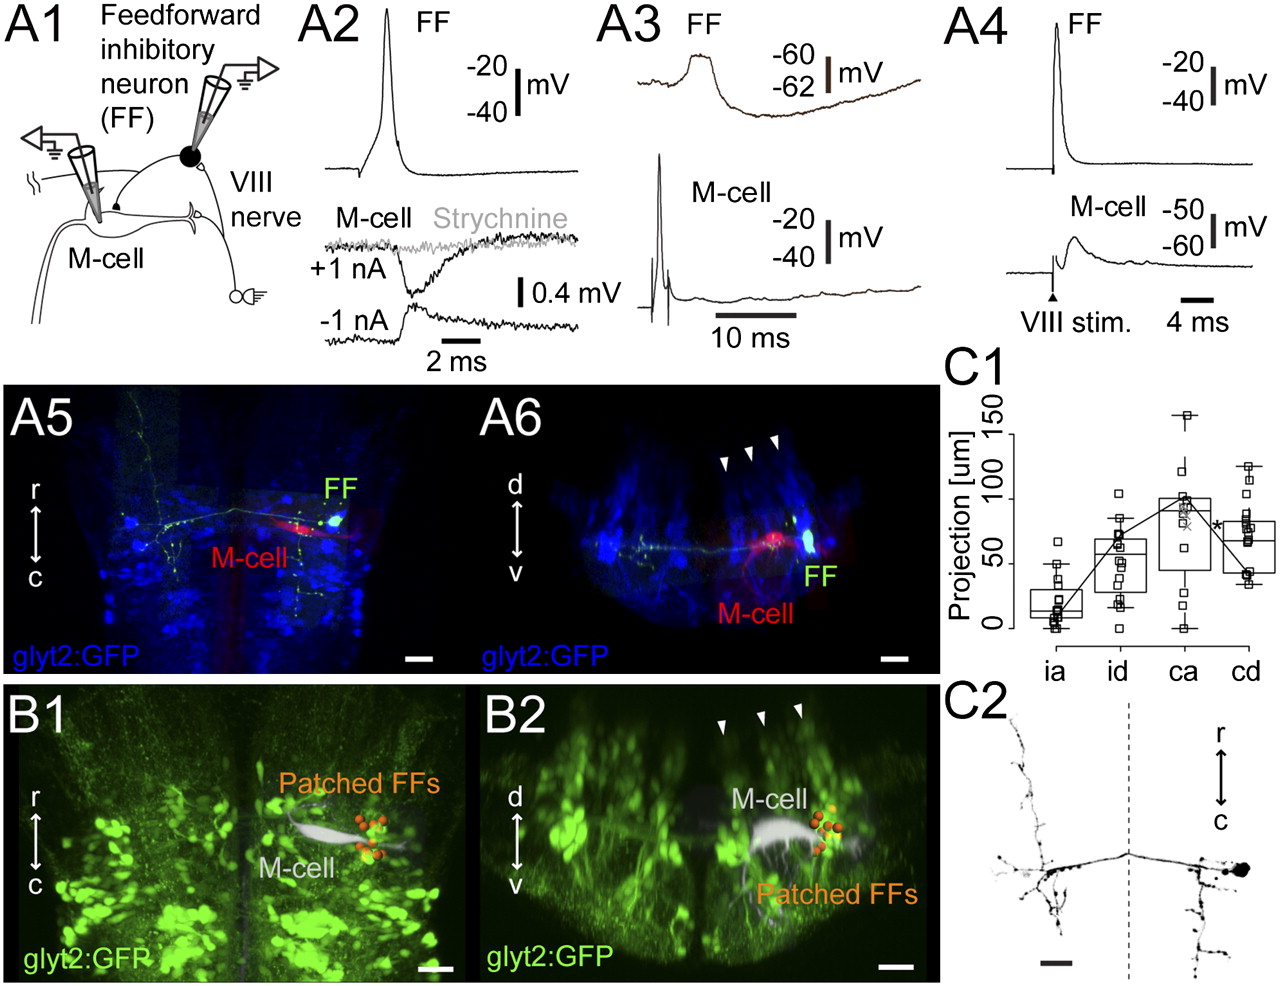
Fig. 2 Feedforward inhibitory neurons. (A1) Pairwise whole-cell recording of a GFP-positive feedforward inhibitory neuron and the ipsilateral M-cell from a Tg(glyt2:GFP) x relaxed line at 4 dpf. (A2) Firing the feedforward neuron led to PSPs (average of five traces) in the M-cell that inverted below threshold (black) and were blocked by strychnine (1 μM, gray). (A3) Response of the feedforward inhibitory neuron to single spikes in the M-cell. (A4) Eighth nerve stimulation led to firing of the interneuron and an EPSP in the M-cell. (A5) Top-down view of the feedforward inhibitory neuron (green) and the M-cell (red) from A2 relative to the glycinergic neurons (blue). (A6) Cross-section of the same neurons, in rhombomere 4. Arrowheads mark glycinergic stripes. (B1 and B2) Location in top-down (B1) and cross-section views (B2) of 12 registered feedforward inhibitory neurons (orange spheres) identified by pairwise recordings. Arrowheads mark the glycinergic stripes. (C) Morphology of feedforward inhibitory neurons (16 cells). One cell is excluded owing to poor filling. (C1) Box-and-whisker plots showing the extent of axonal projections in four directions: ipsilateral ascending (ia), ipsilateral descending (id), contralateral ascending (ca), and contralateral descending (cd). The whiskers extend to the most extreme data point, which is no more than 1.5 times the interquartile range from the box. Asterisk marks the line for the neuron in C2. (C2) Example reconstruction; dotted line marks the midline. (Scale bars, 20 μm.)
Image
Figure Caption
Acknowledgments
This image is the copyrighted work of the attributed author or publisher, and
ZFIN has permission only to display this image to its users.
Additional permissions should be obtained from the applicable author or publisher of the image.
Full text @ Proc. Natl. Acad. Sci. USA

