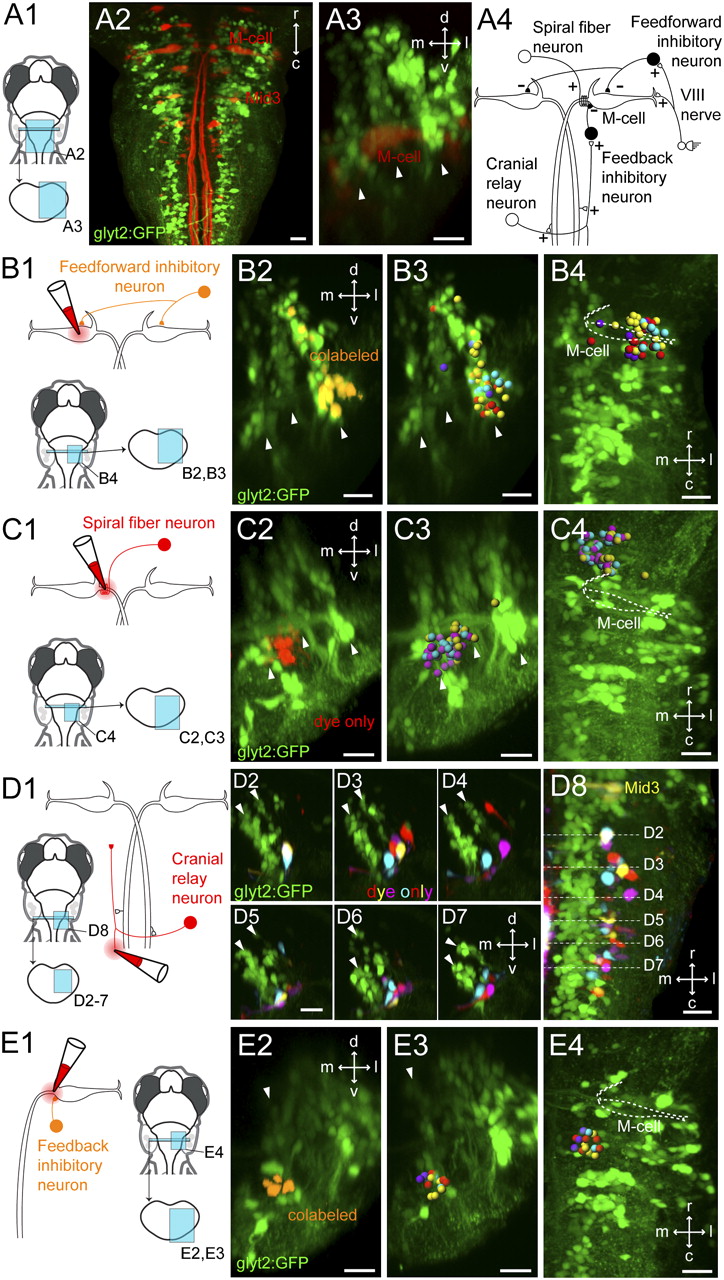
Fig. 1 Retrograde labeling of prospective interneurons in the Mauthner circuit. (A) Location of the M-cell relative to glycinergic neurons in the hindbrain. (A1) Location of images on right. (A2) Dorsal view of a Tg(glyt2:GFP) line at 5 dpf with reticulospinal neurons backfilled from the spinal cord with Texas Red. (A3) Cross-section view of the M-cell and the three glycinergic stripes at rhombomere 4. White arrowheads mark the glycinergic stripes. (A4) Circuit diagram of the Mauthner circuit from goldfish. Excitatory neurons, white; inhibitory neurons, black. (B) Retrograde labeling of potential feedforward inhibitory neurons. (B1) Experimental diagram. (B2) Cross-section view of the backfilled neurons at rhombomere 4 in the Tg(glyt2:GFP) line at 5 dpf. Colabeled voxels are orange. Arrowheads mark glycinergic stripes. (B3) Cross-section from registrations showing the glycinergic neurons from four example fish, with different colored spheres for each. (B4) Top-down view of neurons in B3. White dashed line marks the M-cell. (C) Retrograde labeling of prospective spiral fiber neurons. (C1) Experimental diagram. (C2) Cross-section at rhombomere 3 in the Tg(glyt2:GFP) line at 5 dpf. Voxels that only contain the far red dye used to backfill are shown in red. (C3) Cross-section of the registered reconstructions for three different fish, as in B3. (C4) Top-down view of neurons in C3. M-cell marked by white dashed line. (D) Retrograde labeling of potential cranial relay neurons. (D1) Experimental diagram. (D2?D7) Backfilled neurons from four different fish shown in registered cross sections in rhombomere 7/8. Arrowheads mark medial and middle glycinergic stripes. (D8) Top-down view of the neurons in D2?D7. White lines mark corresponding cross sections. (E) Retrograde labeling of prospective feedback inhibitory neurons. (E1) Experimental diagram. (E2) Cross-section of glycinergic neurons at rhombomere 5 in the Tg(glyt2:GFP) line at 5 dpf. Orange indicates colabeling with GFP and the far red dye. White arrowhead marks medial glycinergic neurons. (E3) Cross-section of the registered reconstructions from four fish. (E4) Top-down view of the same neurons. r/c, rostral and caudal; d/v, dorsal and ventral; m/l, medial and lateral in this and later figures. (Scale bars, 20 μm.)
Image
Figure Caption
Acknowledgments
This image is the copyrighted work of the attributed author or publisher, and
ZFIN has permission only to display this image to its users.
Additional permissions should be obtained from the applicable author or publisher of the image.
Full text @ Proc. Natl. Acad. Sci. USA

