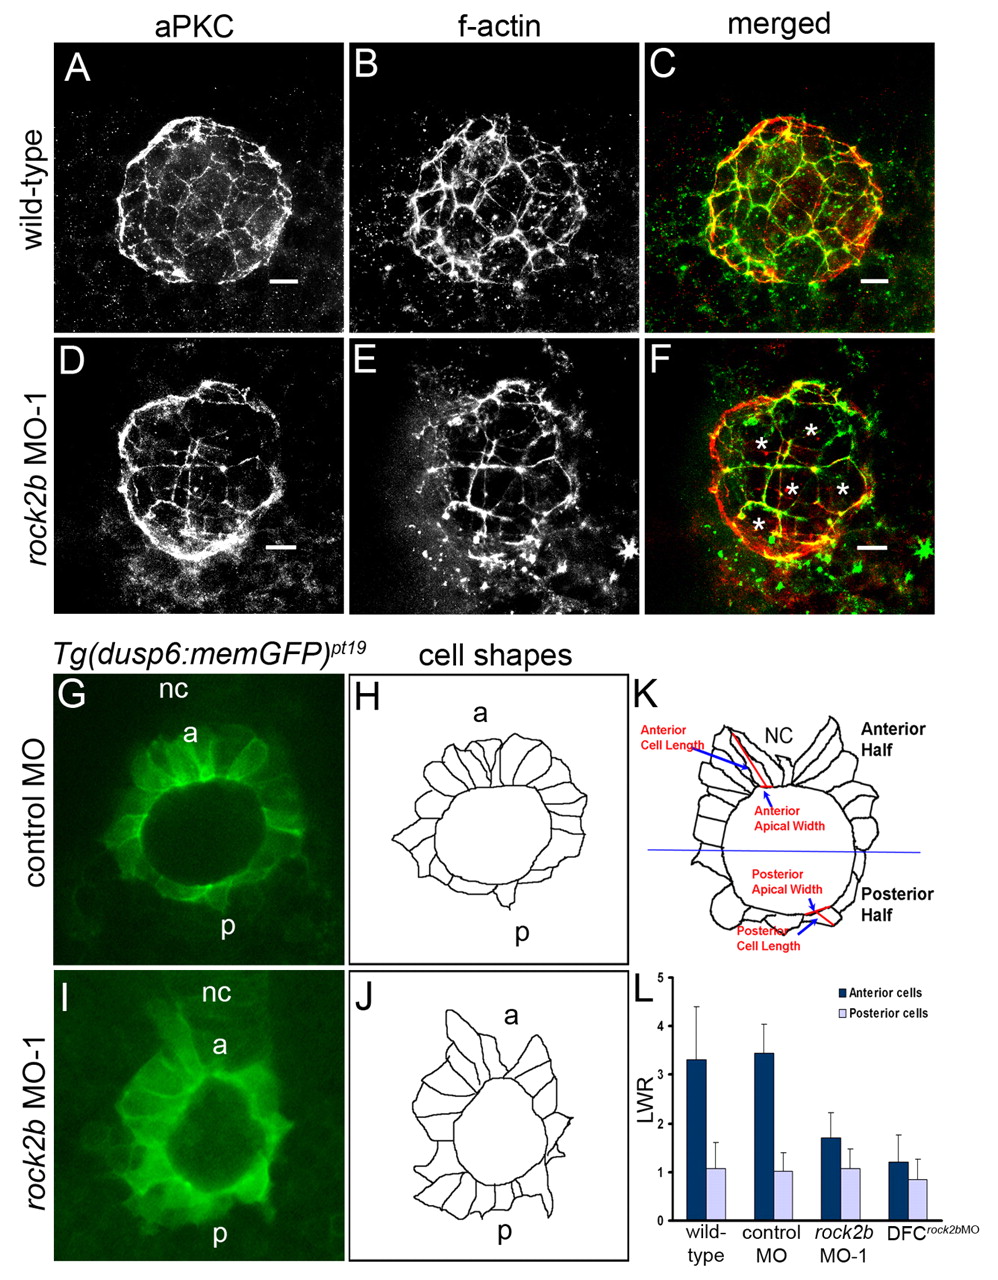
Fig. 7 rock2b knockdown alters KV cell shapes. (A-F) KV cells at 8-SS double fluorescently labeled with aPKC antibodies (A,D) and phalloidin (B,E) to detect apical membrane and filamentous actin (f-actin), respectively. Apical actin structures were present and co-localized with aPKC similarly in wild-type (A-C) and rock2b MO-1 (D-F) embryos, but the architecture of KV appeared different in rock2b MO-1 embryos, in which more KV cells had large apical surfaces (examples are marked by * in F). (G,I) Confocal images of memGFP-labeled KV cells in live Tg(dusp6:memGFP)pt19 transgenic embryos injected with control MO (G) or rock2b MO-1 (I). (H,J) Diagrams show KV cell shapes traced from confocal images. (K) Diagram of KV cells in a wild-type embryo, with a description of how the LWR was measured in anterior and posterior KV cells. (L) The average LWR for wild-type (n=12 embryos) control MO (n=5) and rock2b MO-1 (n=15) and DFCrock2b MO-1 (n=4) embryos. Scale bars: 10 μm. Error bars: 1 s.d. nc, notochord; a, anterior; p, posterior.
Image
Figure Caption
Figure Data
Acknowledgments
This image is the copyrighted work of the attributed author or publisher, and
ZFIN has permission only to display this image to its users.
Additional permissions should be obtained from the applicable author or publisher of the image.
Full text @ Development

