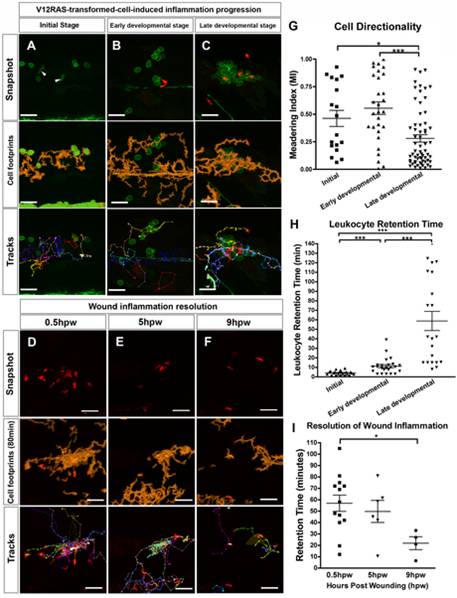
Fig. 3 Time-lapse analysis of leukocyte response to V12RAS+ clone expansion versus wound inflammatory response.
(A) Single image from a movie taken of the trunk region of a Tg(kita:GalTA4, UAS:V12RASeGFP, fli:eGFP) larva, showing an ?initial stage? clone of V12RAS+ cells. Rounded cells with membrane-tagged GFP are V12RAS+ cells; solid green migrating cells are Fli:eGFP+ leukocytes (arrowheads) (Video S5A). (B and C) Images from ?early developmental? and ?late developmental? stage clones in Tg(kita:GalTA4, UAS:V12RASeGFP, LysC:DsRed) larvae (Video S5B and S5C). (D?F) Early (D), medium (E), and late stages (F) of flank laser wounds made to Tg(kita:GalTA4, UAS:eGFP, LysC:DsRed) larval skin (Video S4). Middle panels for (A?F) are the superimposed outlines of cumulated leukocyte footprints (orange) over time-lapse duration. The lower panels are superimposed tracks of all the leukocytes that have migrated through the imaging field during this period (Video S4 and S5). (G) Quantification of the MI of leukocyte migration in the presence of initial, early developmental, and late developmental stages of V12RAS+ clones in the epidermis. (H) Quantification of ?retention time? of the leukocytes that are recruited to V12RAS+ clones at initial, early developmental, and late developmental stages. (I) Quantification of the ?retention time? of leukocytes recruited during initial, early developmental, and late developmental stages of flank laser wounding of larval skin. *, p<0.05; ***, p<0.001. Scale bars = 48 μm.

