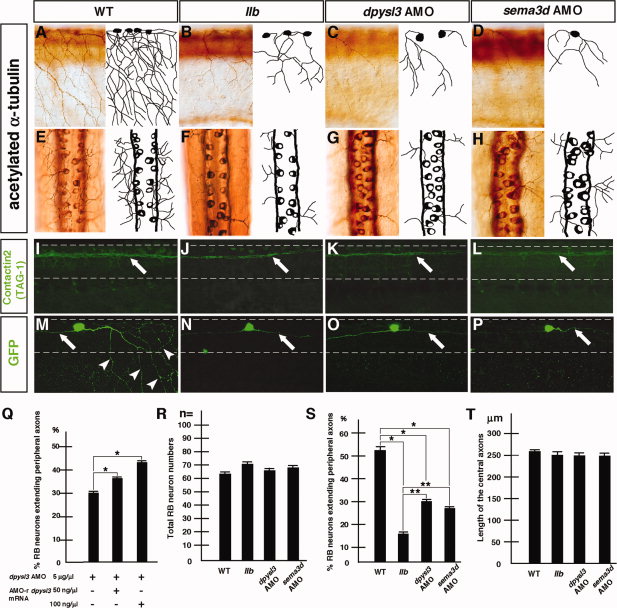
Fig. 6 Loss of function of dpysl3 selectively affects the outgrowth of the peripheral axons of RB neurons. A?H: Phenotypes of RB neurons in the llb embryos, dpysl3 morphants, and sema3d morphants at 28 hpf. Lateral views with anterior at left (A?D). Dorsal views with anterior at top (E?H). Asterisks indicate the cell bodies of RB neurons. I?L: Contactin 2 (TAG-1)-positive central axons (arrows) at 28 hpf. Broken lines indicate the margin of the spinal cord. Lateral views with anterior at left. M?P: zCREST2:GFP-labeled RB neurons at 28 hpf. Broken lines indicate the margin of the spinal cord. Arrows indicate the central axons. Arrowheads in (M) indicate the peripheral axons. Lateral views with anterior at left. Q: Quantitative data for the dpysl3 morphants that were rescued by co-injection of AMO-resistant (AMO-r) dpysl3 mRNA. Data are mean ± SEM; n = 10; *P < 0.05, different from the 5 μg/μl dpysl3 AMO-injected embryos, using 2-tailed paired Student′s t-test. R?T: Quantitative data for phenotypes of RB neurons. Data are mean ± SEM; (n = 10, R, S)(n=5, T); *P < 0.05, different from the wild-type embryos; **P < 0.05, different from the llb embryos, using 2-tailed paired Student′s t-test.
Image
Figure Caption
Figure Data
Acknowledgments
This image is the copyrighted work of the attributed author or publisher, and
ZFIN has permission only to display this image to its users.
Additional permissions should be obtained from the applicable author or publisher of the image.
Full text @ Dev. Dyn.

