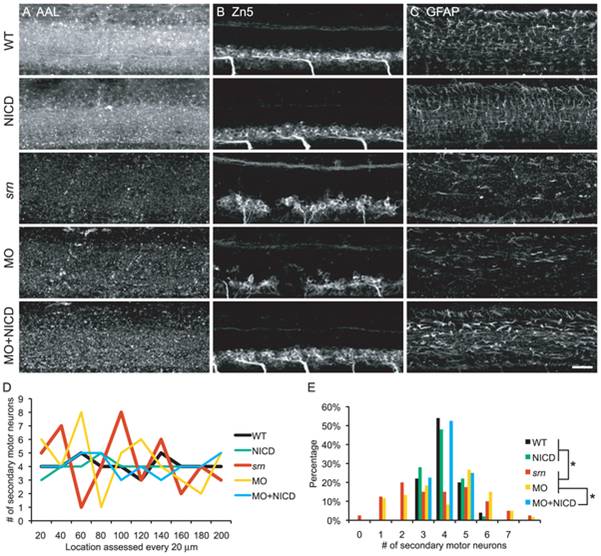
Fig. 6 A. AAL staining is reduced in srn, gmds morphants and gmds morphants overexpressing NICD, but not in WT embryos or WT embryos overexpressing NICD. B. WT and WT overexpressing NICD had normal Zn5+ cell patterning. srn and gmds MO showed Zn5+ cell patterning defects which was rescued by NICD overexpression in gmds morphants. C. WT and WT overexpressing NICD had normal GFAP+ glia cells in spinal cord. srn and gmds morphants had reduced GFAP+ glia cells, rescued by NICD overexpression in gmds morphants (>10 embryos in each experiment). Scale bar = 40 μm. D?E. Quantification of Zn5+ cell patterning defects. There are 3?5 Zn5+ cells every 20 μm in WT, WT overexpressing NICD and gmds MO overexpressing NICD; compared to 1?8 in srn and gmds MO embryos. D, data from a representative embryo; E, distribution of all embryos (4?6 embryos; Kolmogorov-Smirnov test, * p<0.05).
Image
Figure Caption
Figure Data
Acknowledgments
This image is the copyrighted work of the attributed author or publisher, and
ZFIN has permission only to display this image to its users.
Additional permissions should be obtained from the applicable author or publisher of the image.
Full text @ PLoS One

