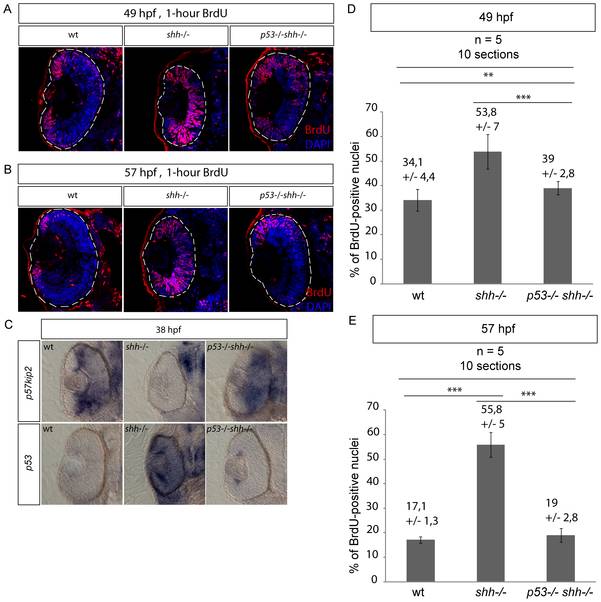
Fig. 8 S-phase progression in wild-type, shh-/- and p53-/-shh-/- mutants was analysed at 49 and 57 hpg after one-hour labelling with BrdU. Confocal sections stained with anti-BrdU antibodies and DAPI are shown with the anterior side to the top. (A) Anti-BrdU/DAPI staining of wild-type, shh-/- and p53-/-shh-/- mutant retinas at 49 hpf identified a greater extent of cell-cycle exit (fewer cells labelled) in the wild-type and p53-/-shh-/- mutant than in the shh-/- retina. The data from these stainings were then used for quantification in (D). (B) At 57 hpf in the wild-type retina, BrdU-positive cells were found only in the ciliary marginal zone (CMZ). However, in the shh-/- mutant retina, cells still failed to exit the cell cycle. Like in the wild-type retina, cells of p53-/-shh-/- mutant mostly exited the cell cycle and proliferative cells were located only in the CMZ. (C) At 38 hpf, p57kip2 expression was at a high level in both wild-type and p53-/-shh-/- mutant retinas, whereas no p57kip2 was present in the shh-/- mutant retina. By contrast, p53 expression was high in the shh-/- mutant retina and very low in the wild-type and p53-/-shh-/- mutant retinas. (D) Proportions of BrdU-positive cells (S-phase indices) in wild-type, shh-/- and p53-/-shh-/- retinas at 49 hpf were obtained from confocal sections such as presented in (A). The S-phase indices in wild-type (34,1%, SD = 4,4%) and p53-/-shh-/- (39%, SD = 2,8%) were each significantly lower than in the shh-/- mutant retina (53,8%, SD = 7%) (t-test, P-value<0,001), the difference between them still being significant (t-test, P-value<0,01). (E) S-phase indices in wild-type, shh-/- and p53-/-shh-/- retinas at 57 hpf were obtained from confocal sections such as presented in (B). The S-phase indices in wild-type (17,1%, SD = 1,3%) and p53-/-shh-/- (19%, SD = 2,8%) were not significantly different (t-test, P-value>0,05), but were each significantly lower than in the shh-/- mutant retina (55,8%, SD = 5%) (t-test, P-value<0,001). Total 10 sections from 5 embryos (2 retinal sections per embryo) were analysed for each genotype and mean +/- standard deviation are indicated above the graph bars. Statistical differences were evaluated using t-test with P-values<0,01 (**) or<0,001 (***).
Image
Figure Caption
Acknowledgments
This image is the copyrighted work of the attributed author or publisher, and
ZFIN has permission only to display this image to its users.
Additional permissions should be obtained from the applicable author or publisher of the image.
Full text @ PLoS One

