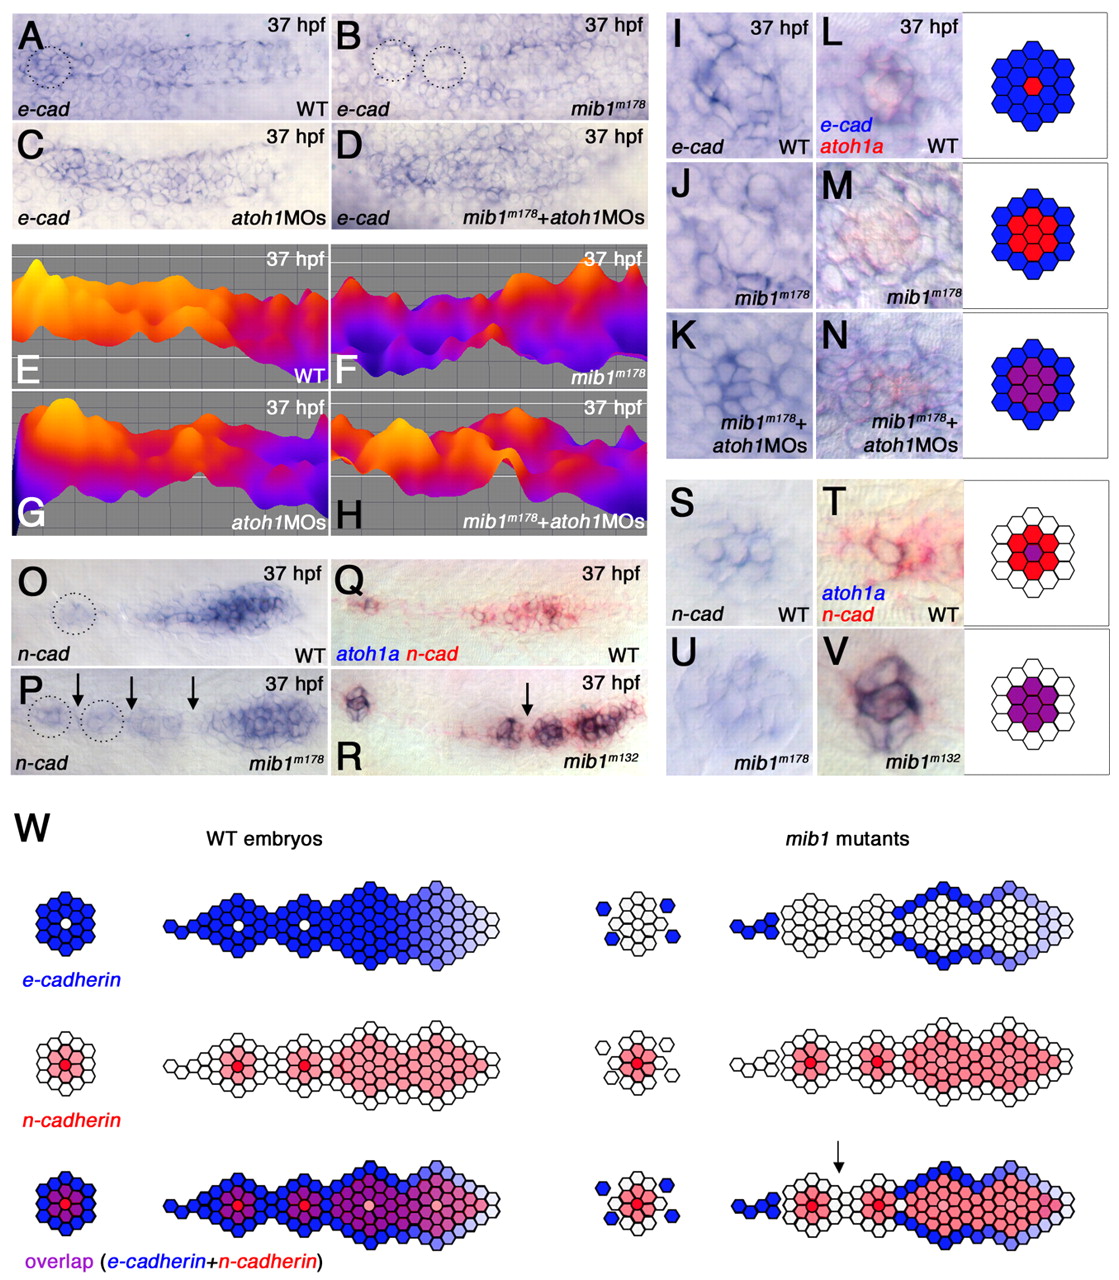
Fig. 7 Changes in pLLp cohesion correlate with changes in Cadherin gene expression. (A-N) e-cadherin expression in the pLLp (A-H) and deposited proneuromasts (I-N) at <37 hpf. (E-H) Color-coded representations of the e-cadherin expression shown in A-D, created using the interactive three-dimensional surface plot plug-in from ImageJ (Abramoff et al., 2004). (A,E) In wild-type, e-cadherin is broadly expressed, being lower at the leading and higher at the trailing proneuromasts prior to deposition. (B,F) e-cadherin expression is suppressed in the pLLp trailing domain of mib1m178 zebrafish embryos (n=8). Dotted circles in B represent domains of suppressed e-cadherin expression. (C,G) atoh1MOs do not substantially alter e-cadherin expression in wild-type embryos (n=7). (D,H) Higher e-cadherin expression in the trailing pLLp is restored in mib1m178+atoh1MOs embryos (n=12). (I,L) e-cadherin expression (blue) is generally more intense, but absent in a central atoh1a-expressing cell (red), in deposited neuromasts (n=6). (J,M) The central atoh1a-expressing domain expands at the cost of e-cadherin in mib1m178 deposited neuromasts (n=6). (K,N) Knockdown of atoh1 in mib1m178 expands e-cadherin expression and allows overlap (purple) with atoh1a (n=13). (O-V) n-cadherin expression in the pLLp (O-R) and deposited proneuromasts (S-V). (O,Q) In wild type, n-cadherin is broadly expressed at the leading end but becomes restricted at the trailing end, prior to neuromast deposition. (P,R) In mib1m178 pLLp, n-cadherin expression is not significantly different from that of wild type. Dotted circles highlight an example of expanded expression of n-cadherin in isolated groups of cells, which are likely to represent prematurely deposited proneuromasts from a recently fragmented pLLp. (Q,R,T,V) Double in situ hybridization showing atoh1a (blue) and n-cadherin (red) expression. (S-V) In deposited neuromasts, n-cadherin expression is similar in wild type (S,T) and mib1 mutants (U,V). In wild type, a central cell expressing atoh1a and n-cadherin (purple in T) is surrounded by cells expressing only n-cadherin (red in T). In mib1 mutants, atoh1a expands and overlaps with n-cadherin (purple in V). (W) The pLLp and neuromasts normally contain cells that express e-cadherin (blue) or n-cadherin (red). Intervening cells expressing both e-cadherin and n-cadherin (purple) provide an adhesive link between cells that express distinct cadherins. When Notch signaling fails, atoh1a expression expands and e-cadherin is lost from intervening cells that would otherwise express both Cadherin genes. As e-cadherin- and n-cadherin-expressing populations are now unable to establish effective adhesive interactions, the pLLp fragments. Arrow indicates predicted point of fragmentation.
Image
Figure Caption
Acknowledgments
This image is the copyrighted work of the attributed author or publisher, and
ZFIN has permission only to display this image to its users.
Additional permissions should be obtained from the applicable author or publisher of the image.
Full text @ Development

