Fig. 3
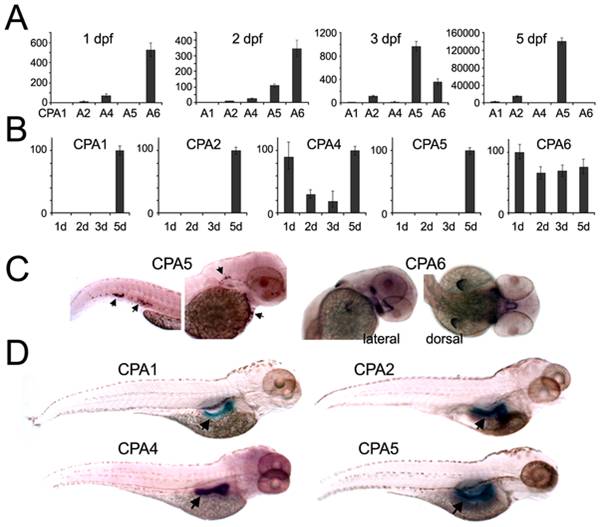
Fig. 3 Temporal and spatial expression of zebrafish CPA genes.
(A, B) qPCR was performed using cDNA prepared from zebrafish at the indicated developmental time points. All values were normalized to β-actin, and are shown in (A) as expression relative to CPA1 mRNA at 2 dpf, or in (B) as expression of each gene relative to its highest level (100%). (C, D) In situ hybridization was used to determine the spatial distribution of CPA mRNA expression. (C) At 2 dpf CPA5 mRNA (arrows) was detected in a mast cell population and CPA6 mRNA was seen in precursor tissues found in the stomodeum, posterior to the eyes, and in the pectoral fin buds. (D) At 4 dpf, mRNA for CPA1, 2, 4, and 5 were expressed in the pancreas.

