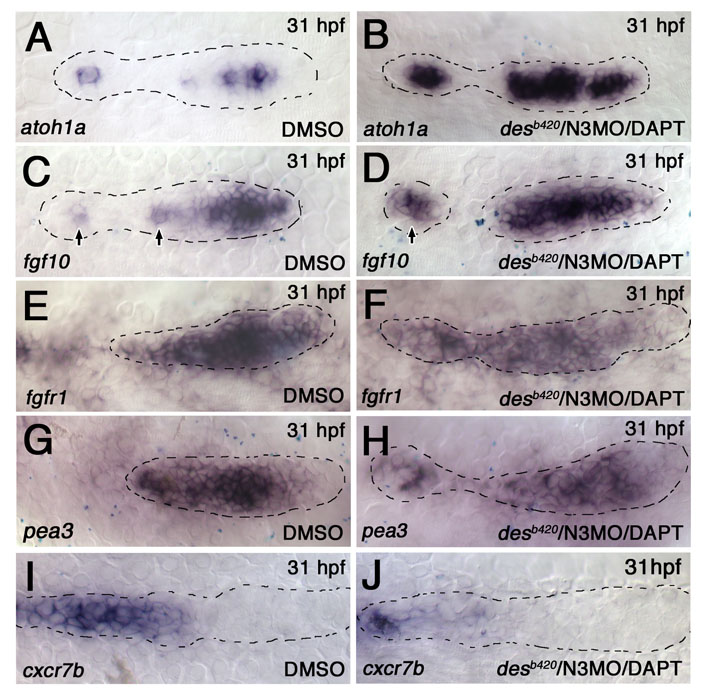
Fig. S7 fgf10 expansion and complementary loss of fgfr1 expression and FGF-dependent gene expression in desb420/N3MO/DAPT embryos. Expression of atoh1a, fgf10, fgfr1, pea3, and cxcr7b in desb420/N3MO/DAPT embryos. (A) atoh1a expression in a wild-type pLLp is broad at the leading end but restricted to a single cell in the trailing end (arrows) (n=10/10). (B) atoh1a expression expands at the trailing end and in deposited neuromasts (arrow) in the desb420/N3MO/DAPT embryos (n=7/7). (C) fgf10 expression in a wild-type pLLp is broad at the leading end but restricted to a single cell in the trailing end (arrows) (n=7/7). (D) fgf10 expression expands at the trailing end and in deposited neuromasts (arrow) in the desb420/N3MO/DAPT embryos (n=9/9). (E,F) fgfr1 is broadly expressed in control DMSO-treated embryos. The fgfr1-negative cell at the center is hard to see in this example. The central fgfr1-negative domain expands in desb420/N3MO/DAPT embryos, as seen in the trailing neuromast in this example (n=8/8). (G,H) pea3 expression is reduced in desb420/N3MO/DAPT embryos compared with DMSO-treated control embryos (n=6/7). (I,J) cxcr7b expression is reduced in desb420/N3MO/DAPT embryos (n=6/6).
Image
Figure Caption
Acknowledgments
This image is the copyrighted work of the attributed author or publisher, and
ZFIN has permission only to display this image to its users.
Additional permissions should be obtained from the applicable author or publisher of the image.
Full text @ Development

