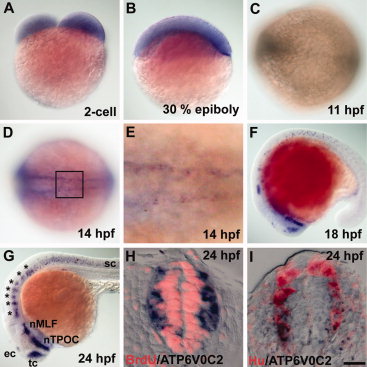
Fig. 2 atp6v0c2 expression revealed by in situ RNA hybridization. A, B: Lateral views of (A) 2-cell stage and (B) 30% epiboly-stage embryos, dorsal at the top. C, D: Dorsal view of the trunk region of 11-hpf (C) and 14-hpf (D) embryos, anterior to the left. E: High-magnification image of the boxed area in D. F, G: Lateral views of 18-hpf (F) and 24-hpf (G) embryos, anterior to the left. tc, telencephalic cluster; ec, epiphysial cluster; nTPOC, nucleus of the tract of the post optic commissare; nMLE, nucleus of the medial longitudinal fasciculus; sc, spinal cord. H, I: Transverse sections of the spinal cord of a 24-hpf embryo, dorsal at the top. H: Sections were processed by in situ hybridization with an atp6v0c2 RNA probe and subsequent labeled with anti-BrdU antibody (red staining). I: Sections were processed by in situ hybridization with an atp6v0c2 RNA probe and subsequent labeling with anti-Hu antibody (red staining). Scale bar: A?D, F, G, 80 μm; E, H, I, 20 μm.
Image
Figure Caption
Figure Data
Acknowledgments
This image is the copyrighted work of the attributed author or publisher, and
ZFIN has permission only to display this image to its users.
Additional permissions should be obtained from the applicable author or publisher of the image.
Full text @ Dev. Dyn.

