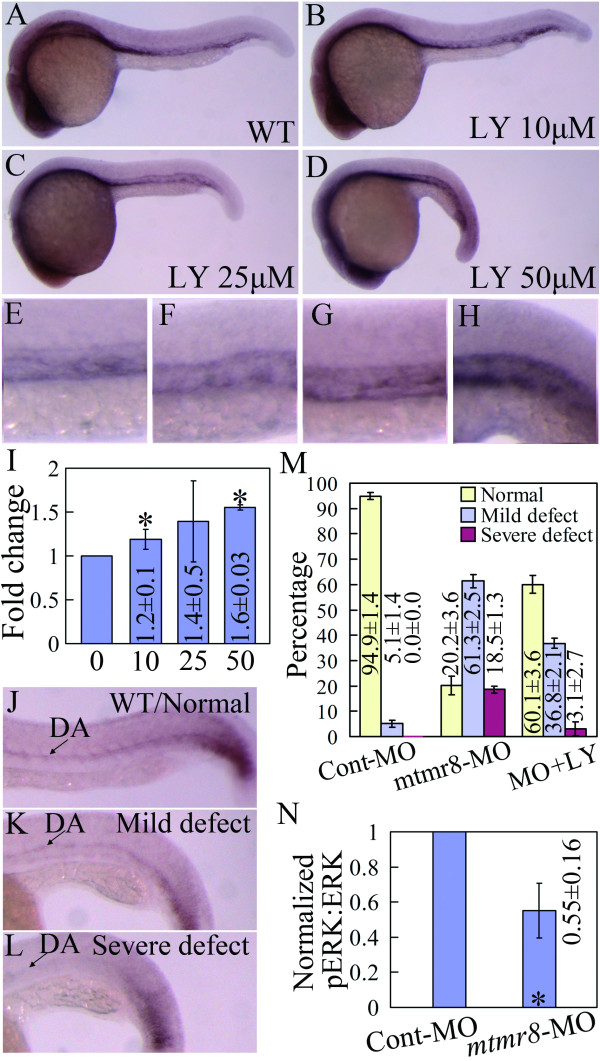
Fig. 5 Mtmr8 negatively regulates the PI3K/Akt pathway. (A-D) Mtmr8 expression in wild type (WT) embryo (A) and the treated embryos (C-D) with different doses of LY294002 (LY) at 26 hpf. (E-H) The corresponding amplification of A-D, showing the detailed changes in the trunk vasculature. (I) Mtmr8 expression changes revealed by Q-RT-PCR in embryos treated with different doses of LY294002 (μM). (J-L) Three phenotypes of ephrinB2a expression and quantification data (M) in 26 hpf Mtmr8 morphants (30 embryos in each experiment group). (N) Quantitative Western blot data of ERK phosphorylation in 20-somite Mtmr8 morphants. * Indicates significance of p < 0.05.
Image
Figure Caption
Figure Data
Acknowledgments
This image is the copyrighted work of the attributed author or publisher, and
ZFIN has permission only to display this image to its users.
Additional permissions should be obtained from the applicable author or publisher of the image.
Full text @ BMC Dev. Biol.

