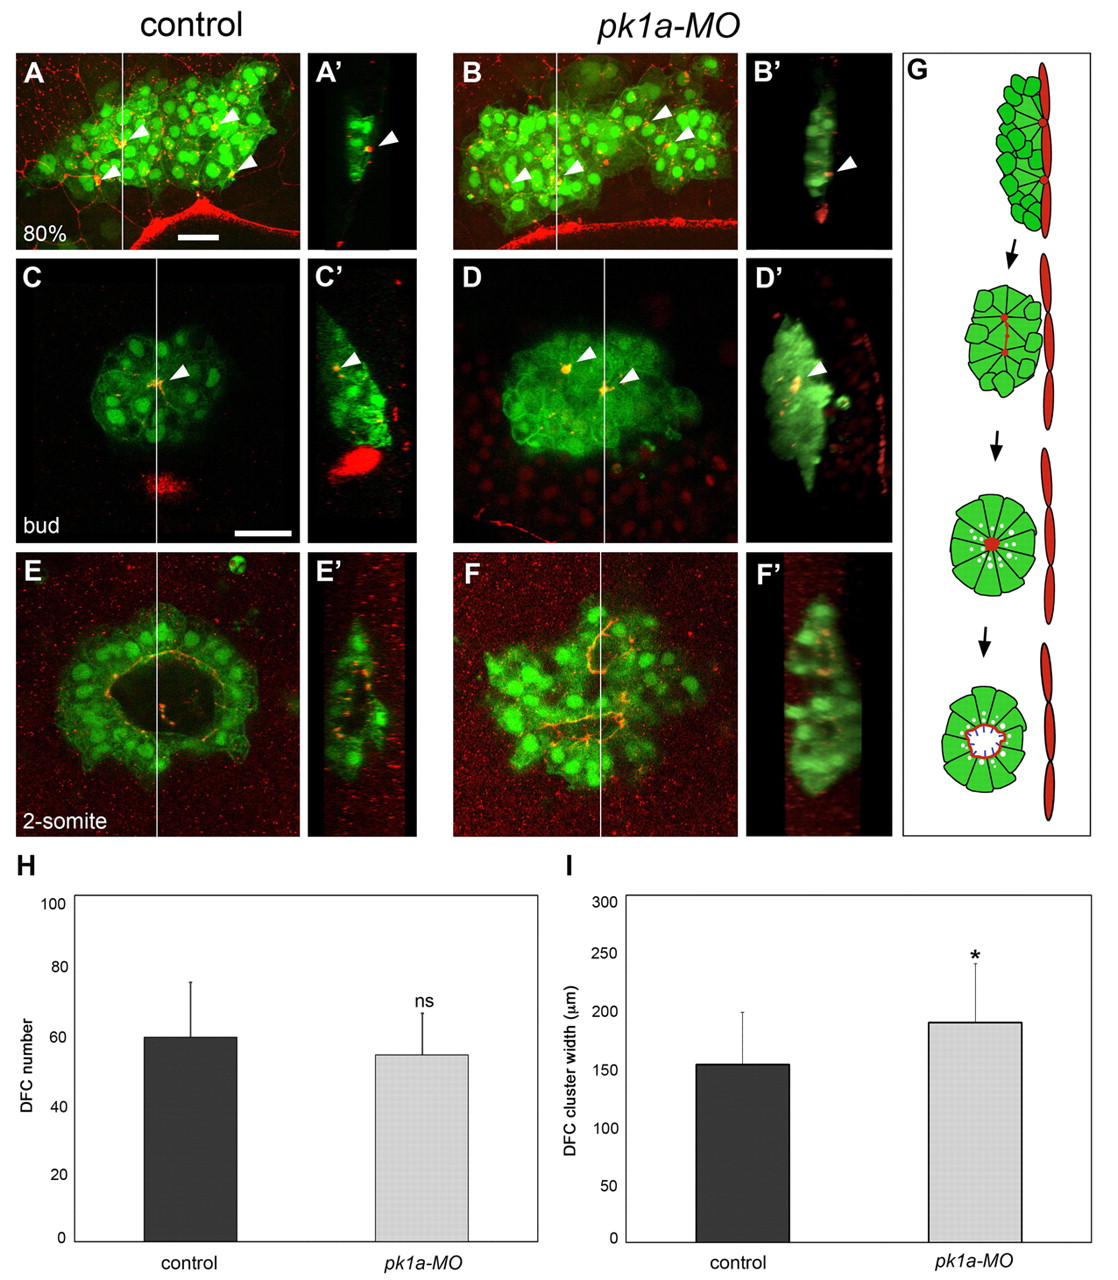
Fig. 4 Pk1a is required for DFC cluster organisation and KV lumen morphogenesis. (A-B′) DFC cluster organisation at 80% epiboly in control and pk1a-MO-injected zebrafish embryos expressing sox17::GFP and immunostained with anti-ZO-1 antibody. Dorsal projections of confocal z-stacks (A,B) and sagittal views at the position of the line (A′,B′; embryo surface to the right) are shown. Animal pole is to the top. In a control embryo, DFCs form a compact cluster that is in contact with the interior surface of the enveloping layer (EVL) close to the margin. Anti-ZO-1 staining reveals distinct accumulations of ZO-1 that mark contact points (arrowheads) between DFCs and the overlying EVL (A,A′). In a pk1a-MO embryo, the DFC cluster is wider and more irregularly shaped than in the control. ZO-1-rich attachment points (arrowheads), similar to those of the control, are observed (B,B′). (C-F′) DFC cluster organisation at bud and 2-somite stages in control and pk1a-MO embryos expressing sox17::GFP and immunostained with anti-ZO-1 antibody. Single focal planes at the centre of the cluster (C-F) and sagittal views of the cluster at the position of the line (C′-F′; embryo surface to the right) are shown. Anterior is to the top. In a bud-stage control embryo, a single major focal point enriched for ZO-1 (arrowheads) is seen at the centre of the cluster (C,C′). The cluster is disconnected from the overlying EVL (C′). In a bud-stage pk1a-MO embryo, two major focal points are observed within the cluster (D,D′; arrowheads). In a 2-somite stage control embryo, a single large lumen is seen in the interior of the DFC cluster and is delineated by anti-ZO-1 signal (E,E′). A 2-somite stage pk1a-MO embryo shows two distinct lumina (F,F′). (G) Schematic representation of KV lumen formation. (H) Graphic representation of DFC number (mean ± s.d.; n=24 control and n=22 pk1a-MO embryos; P<0.01). (I) Graphic representation of DFC cluster width (mean ± s.d.; n=29 control and 29 pk1a-MO embryos; *, P<0.01). ns, not significant. Scale bars: 30 μm.
Image
Figure Caption
Figure Data
Acknowledgments
This image is the copyrighted work of the attributed author or publisher, and
ZFIN has permission only to display this image to its users.
Additional permissions should be obtained from the applicable author or publisher of the image.
Full text @ Development

