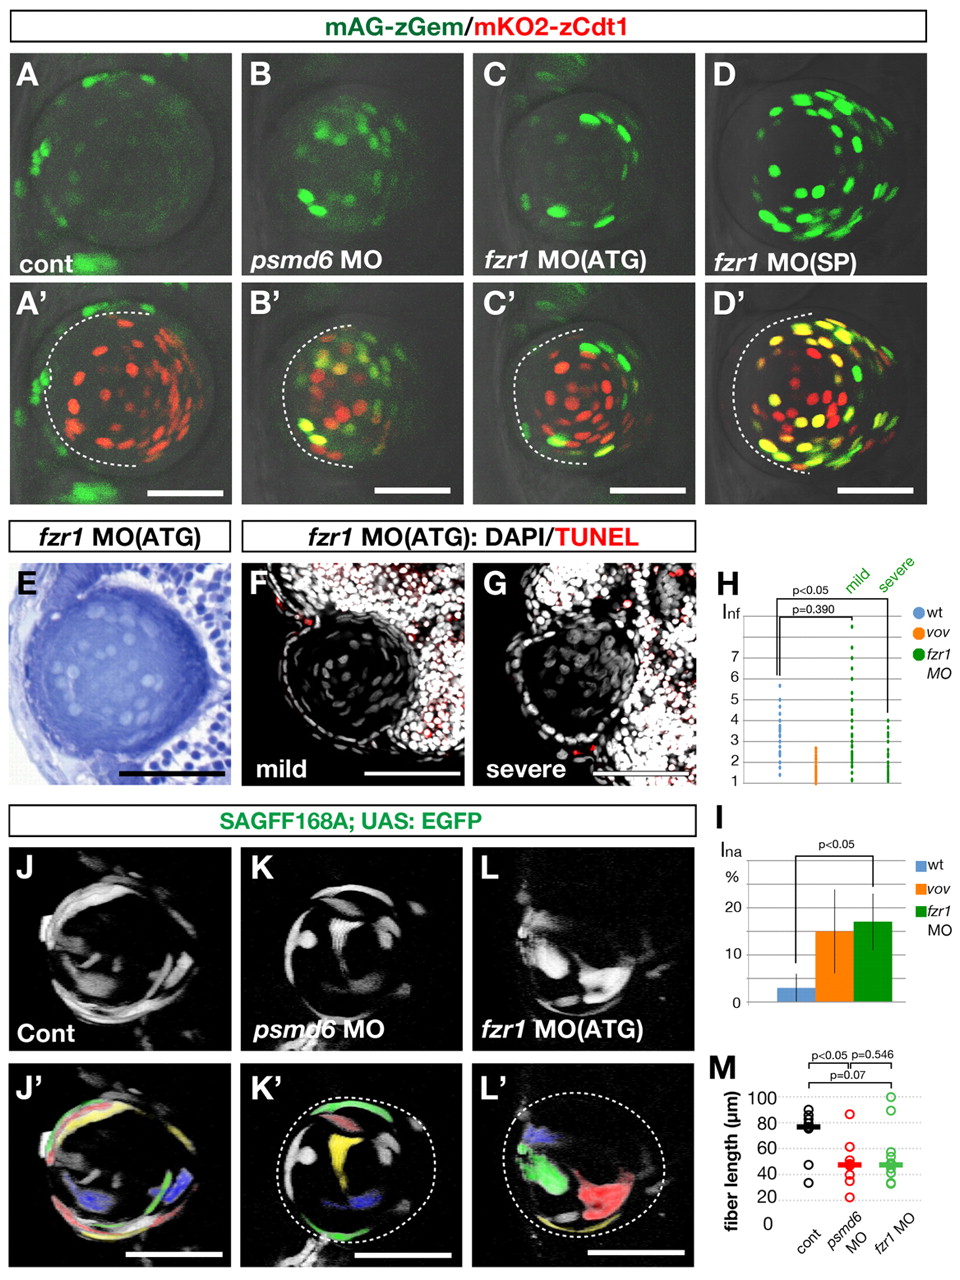
Fig. 8 APC/C is required for lens fiber differentiation. (A-D′) Confocal images of 48 hpf wild type (A′), psmd6 morphant (B′), fzr1 ATG-morphant (C′) and fzr1 splicing-morphant (D′) zebrafish lens in the Cecyil transgenic background. (A-D) Green channel (mAG-zGem) only. Dashed lines indicate the interface between the lens epithelium and lens fiber core. mAG-zGem and mKO2-zCdt1 (red) expression overlap in the lens fiber cells of psmd6 and fzr1 morphants. mAG-zGem (green) expression is absent in the epithelium of psmd6 (B′) and fzr1 (C′,D′) morphant lens. The reduction of mAG-zGem seems to correlate with the absence of BrdU/EdU incorporation (Fig. 2L and see Fig. S9 in the supplementary material). (E) Lens of 72 hpf fzr1 morphant. (F,G) TUNEL (red) and DAPI (gray) labeling of 72 hpf lens of mild (F) and severe (G) fzr1 morphants. (H) Inf of wild type, vov mutant, and mild and severe fzr1 morphants at 72 hpf. (I) Ina for wild type, vov mutant and fzr1 morphant at 72 hpf. (J-L′) Confocal images of the lens of 48 hpf wild type (J), psmd6 morphant (K) and fzr1 morphant (L) expressing the SAGFF168A; UAS:EGFP transgenes. Individual lens fiber cells are indicated by pseudocolors (J′-L′). (M) Individual lens fiber lengths of wild type, psmd6 morphant and fzr1 morphant. The average fiber length (horizontal bars) is 50% shorter in both morphants than in the wild type. Scale bars: 50 Ám.
Image
Figure Caption
Figure Data
Acknowledgments
This image is the copyrighted work of the attributed author or publisher, and
ZFIN has permission only to display this image to its users.
Additional permissions should be obtained from the applicable author or publisher of the image.
Full text @ Development

