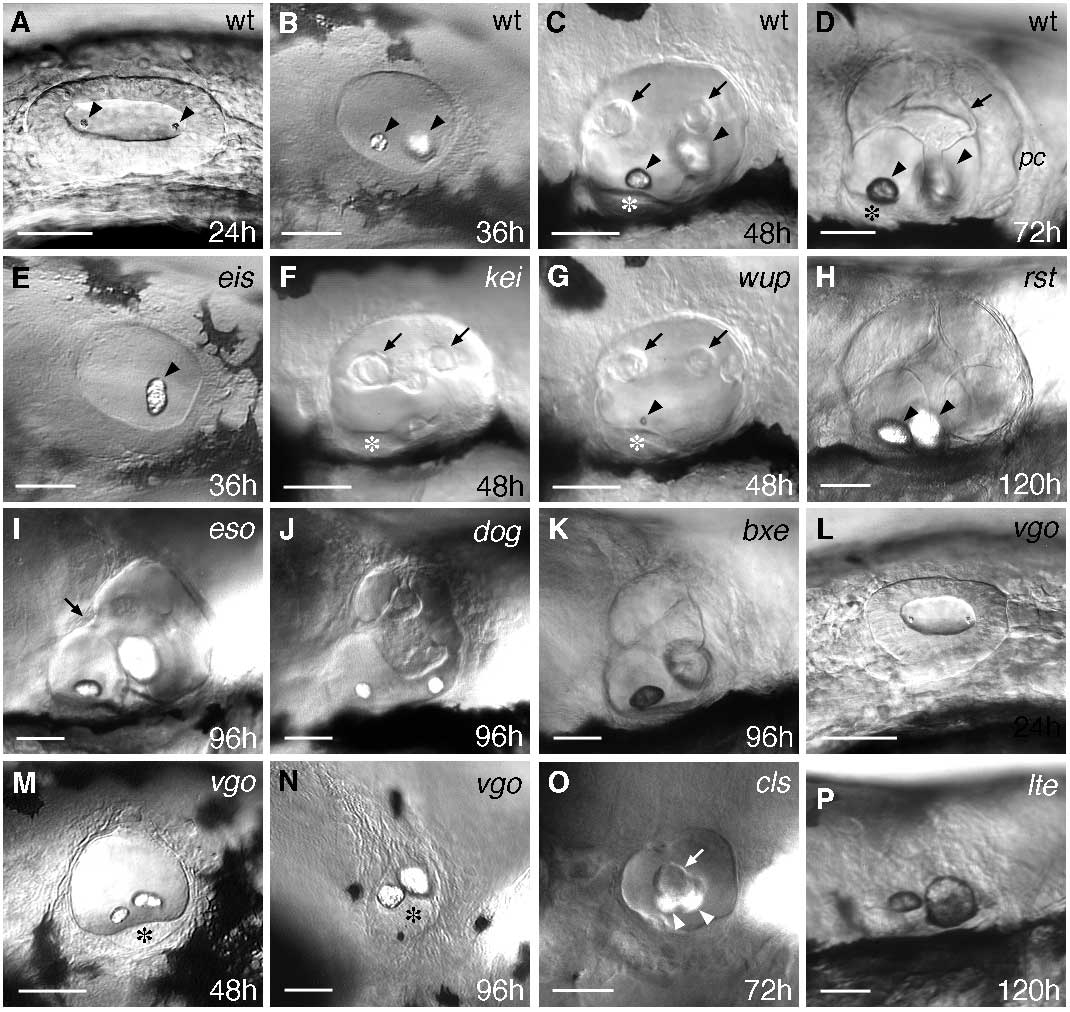
Fig. 2 DIC images showing the ear phenotypes of live mutants. (A-D) Lateral views of wild-type (wt) ears, for comparison with the mutant phenotypes. Ages are given in hours (h) for each image. From 72-120 hours, the appearance of the ear does not change much, although the vesicle and otoliths increase in size (see Fig. 1 for appearance of the ear at 96 hours, with explanatory diagram). (B-P) Selected examples of the mutant phenotypes. Gene names and ages are shown for each image; see text for details. Arrowheads indicate otoliths; arrows mark epithelial projections in the ear which form the semicircular canals. Asterisks indicate the anterior sensory macula. pc, posterior crista. Scale bars, 50 μm.
Image
Figure Caption
Figure Data
Acknowledgments
This image is the copyrighted work of the attributed author or publisher, and
ZFIN has permission only to display this image to its users.
Additional permissions should be obtained from the applicable author or publisher of the image.
Full text @ Development

