
|
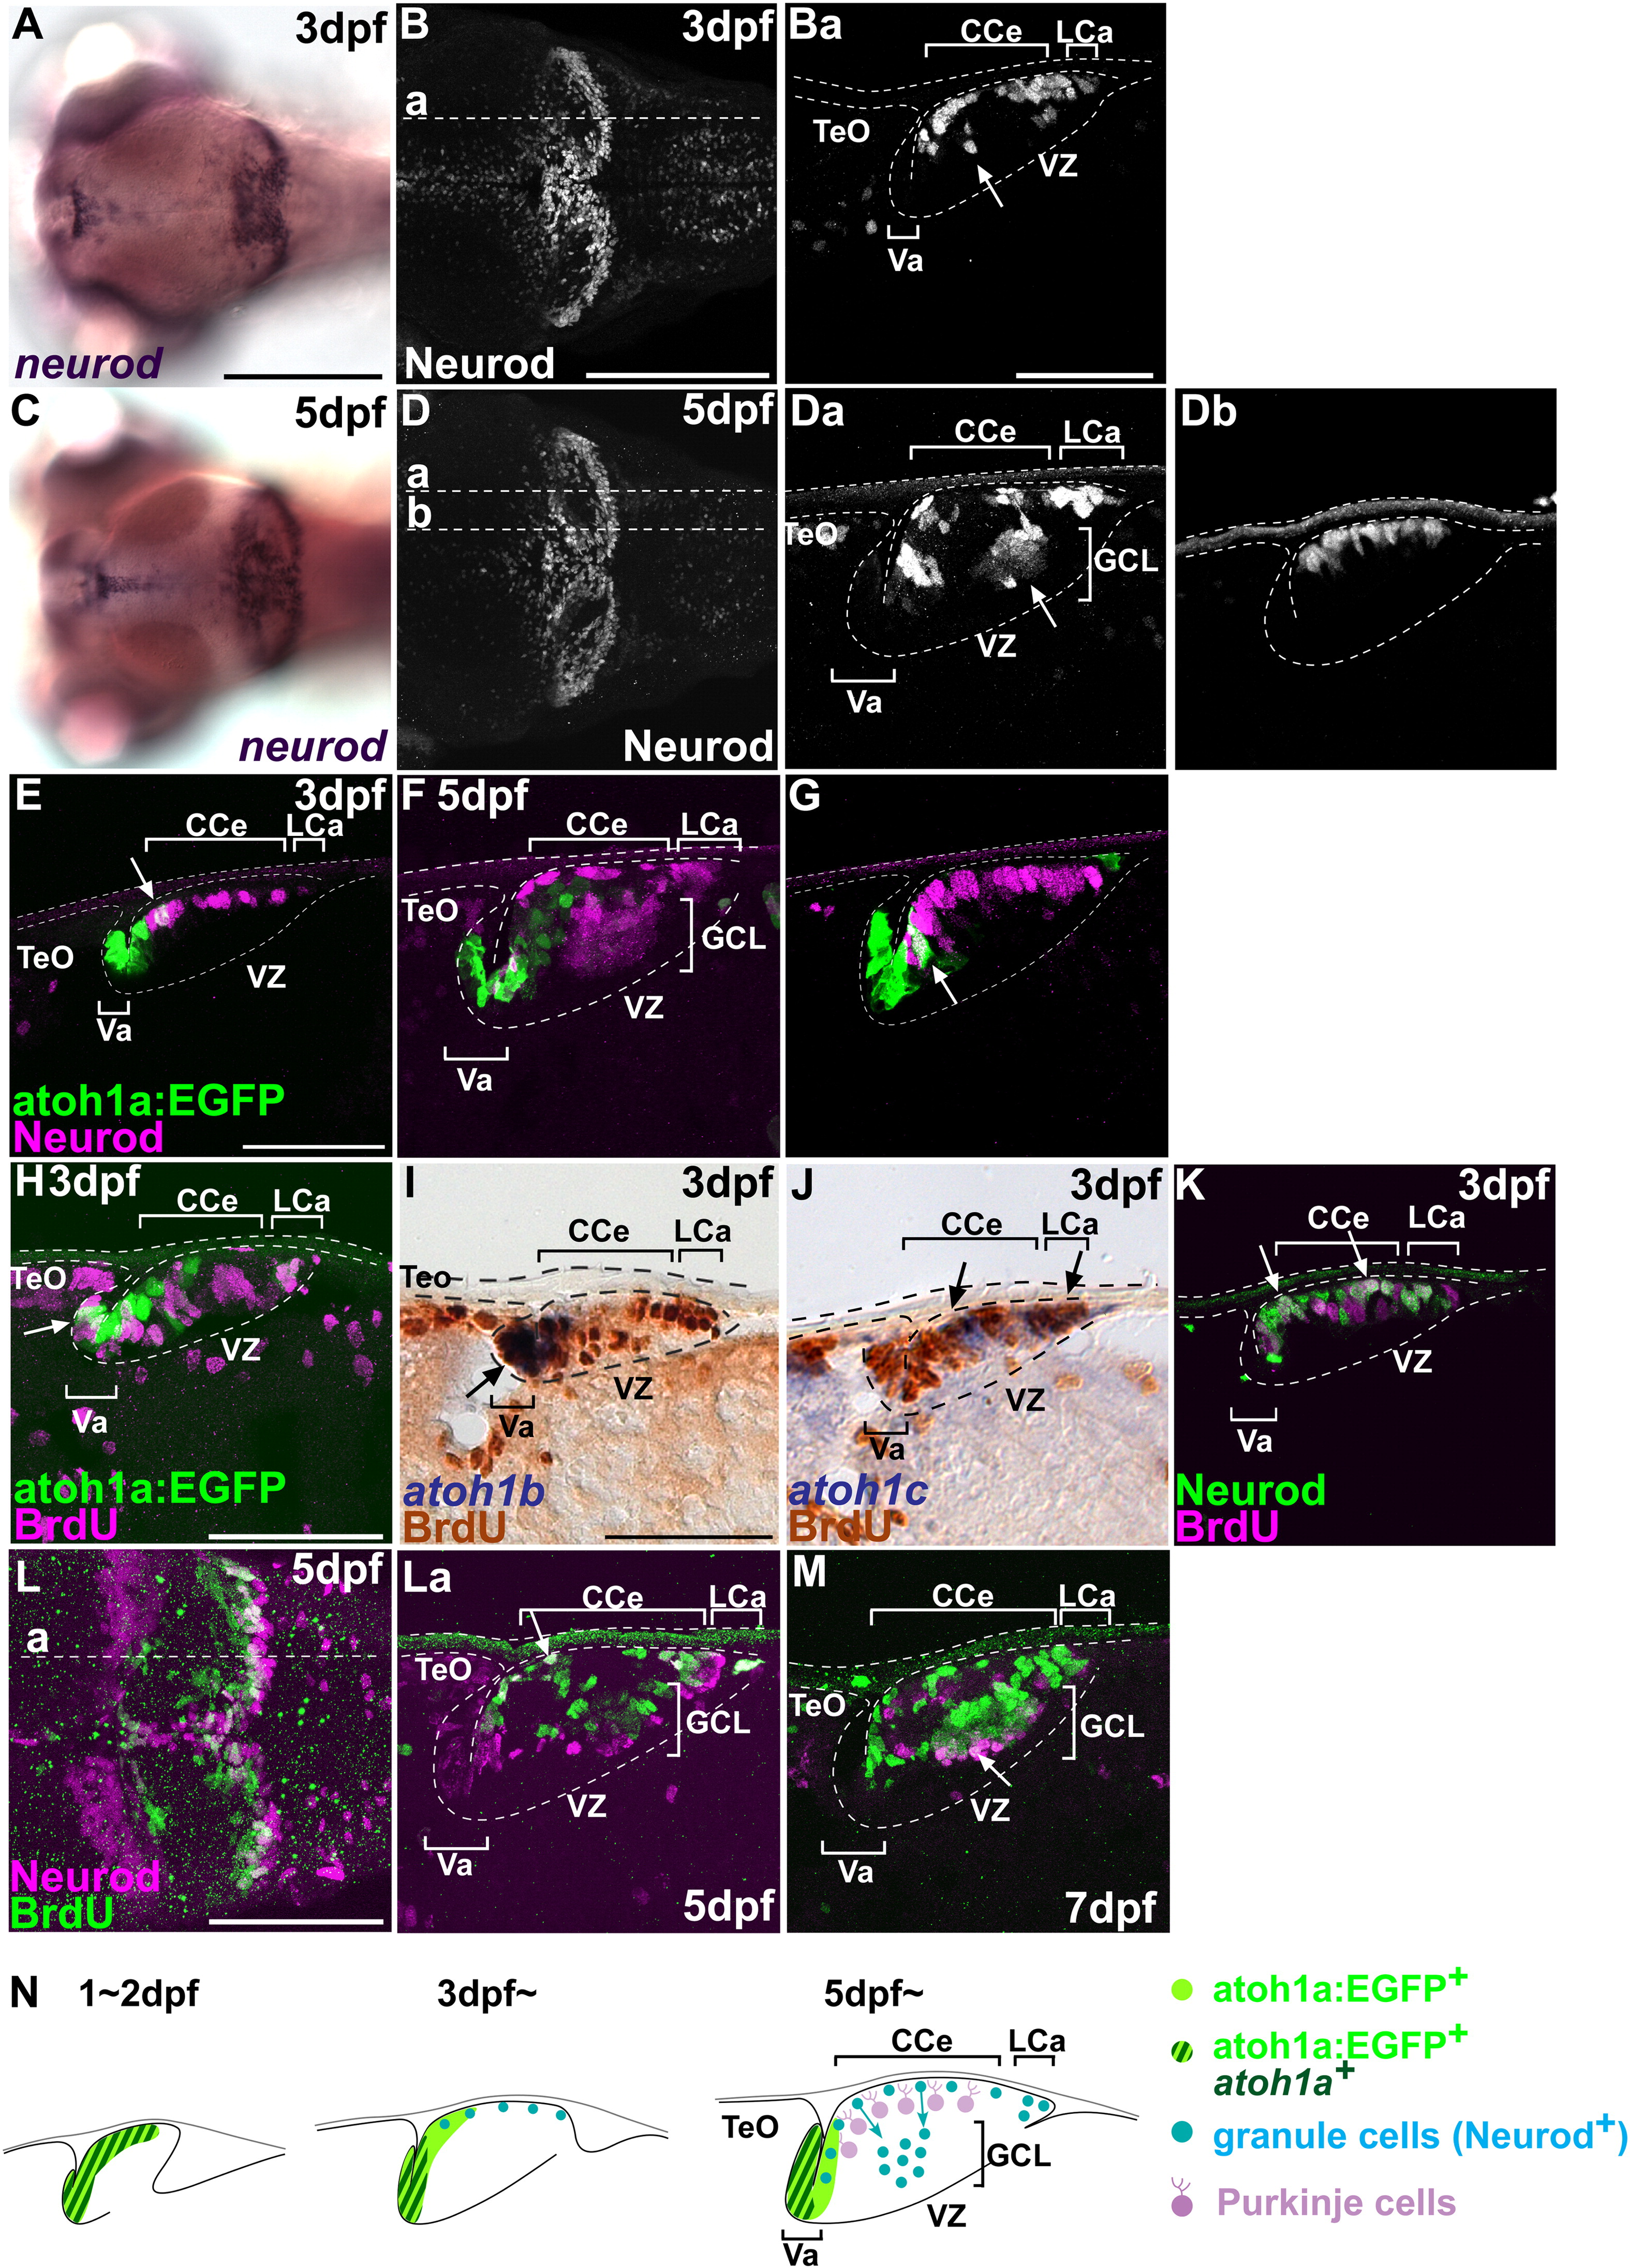
Fig. 3 Behavior of granule cells. (A?D) Expression of neurod at 3 (A, B) and 5 (C, D) dpf. Dorsal views (A, B, C, D) and sagittal sections at the levels indicated in B and D (Ba, Da, Db). Neurod+ mature granule cells in the granule cell layer are marked by arrows. (E, F) Expression of atoh1a:EGFP (green) and Neurod (magenta) at 3 (E) and 5 dpf (F, G). Sagittal sections at the levels comparable to Ba (for E), Da (for F), and Db (for G). atoh1a:EGFP+ Neurod+ cells are marked by arrows. (H?K) BrdU incorporation at 3 dpf. Tg(atoh1a:EGFP) (H) or wild-type larvae (I?K) were labeled with bromodeoxyuridine (BrdU) for 1 h, and proliferating cells were analyzed by immunostaining with anti-BrdU (magenta in H and K; brown in I and J) antibody, and anti-EGFP (green, H), anti-Neurod (green, K) antibodies, atoh1b (I) or atoh1c (J) riboprobes sagittal sections. The larvae were stained with anti-BrdU (magenta) and anti-Neurod (green) antibodies. Cells that were positive both for BrdU signals and proneural gene expression are marked by arrows. (L, M) Birthdate analysis. Larvae were labeled with BrdU at 5 dpf and fixed 1 h after the labeling (L) or at 7 dpf (two days after the labeling, M). Dorsal view (L) and sagittal sections at the mediolateral level (La and M). BrdU+ Neurod+ cells are marked by arrows. (N) Schematic representation of granule cell development during the larval period. TeO, tectum opticum; GCL, granule cell layer; other abbreviations are described in Fig. 1. Scale bars: 50 μm (Ba, E, H), 100 μm (L), 200 μm (A, B).
Reprinted from Developmental Biology, 343(1-2), Kani, S., Bae, Y.K., Shimizu, T., Tanabe, K., Satou, C., Parsons, M.J., Scott, E., Higashijima, S.I., and Hibi, M., Proneural gene-linked neurogenesis in zebrafish cerebellum, 1-17, Copyright (2010) with permission from Elsevier. Full text @ Dev. Biol.