Image
Figure Caption
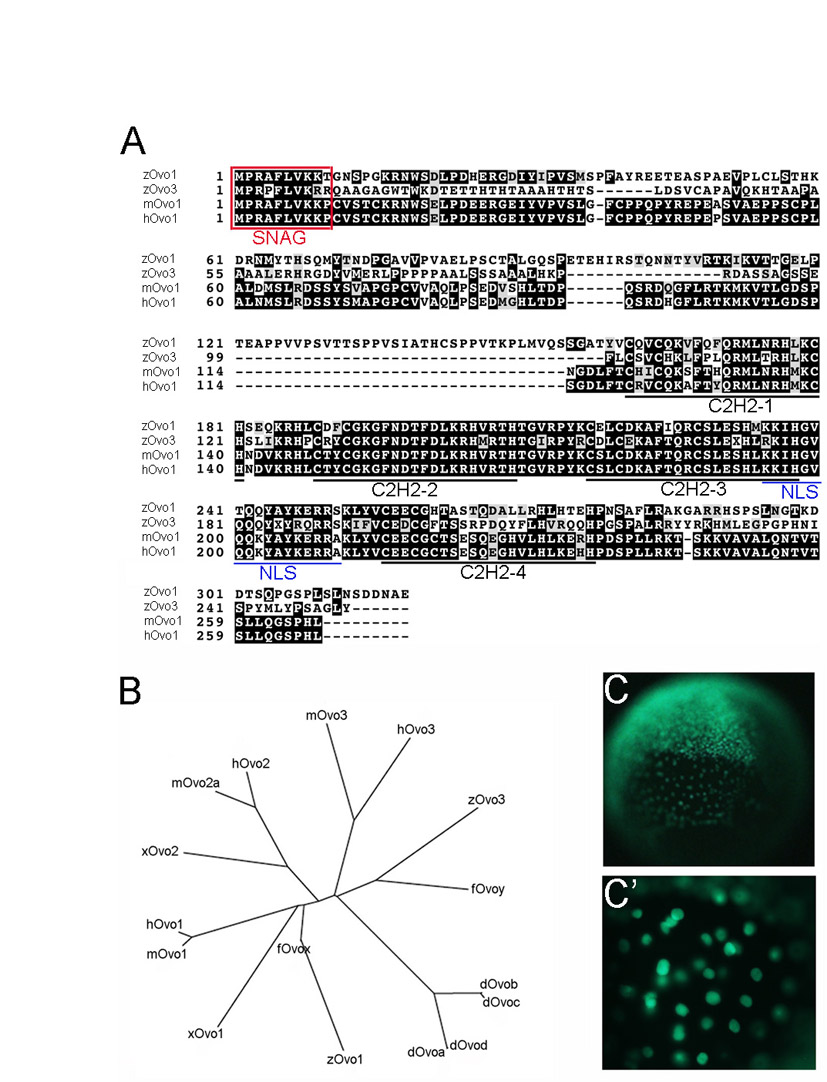
Fig. S1 Characterization of zebrafish Ovo orthologs. (A) Alignment of zebrafish Ovo1 and Ovo3 sequences with mouse and human Ovo1. The transcriptional repression SNAG domain is boxed (red). The four C2H2 zinc finger and nuclear localization (NLS) motifs are underlined in black and blue, respectively. (B) Phylogenetic tree of the Ovo family of transcription factors. (C,C′) Nuclear localization of Gfp:Ovo1 following injection into 1-cell-stage zebrafish embryos.
Acknowledgments
This image is the copyrighted work of the attributed author or publisher, and
ZFIN has permission only to display this image to its users.
Additional permissions should be obtained from the applicable author or publisher of the image.
Full text @ Development

