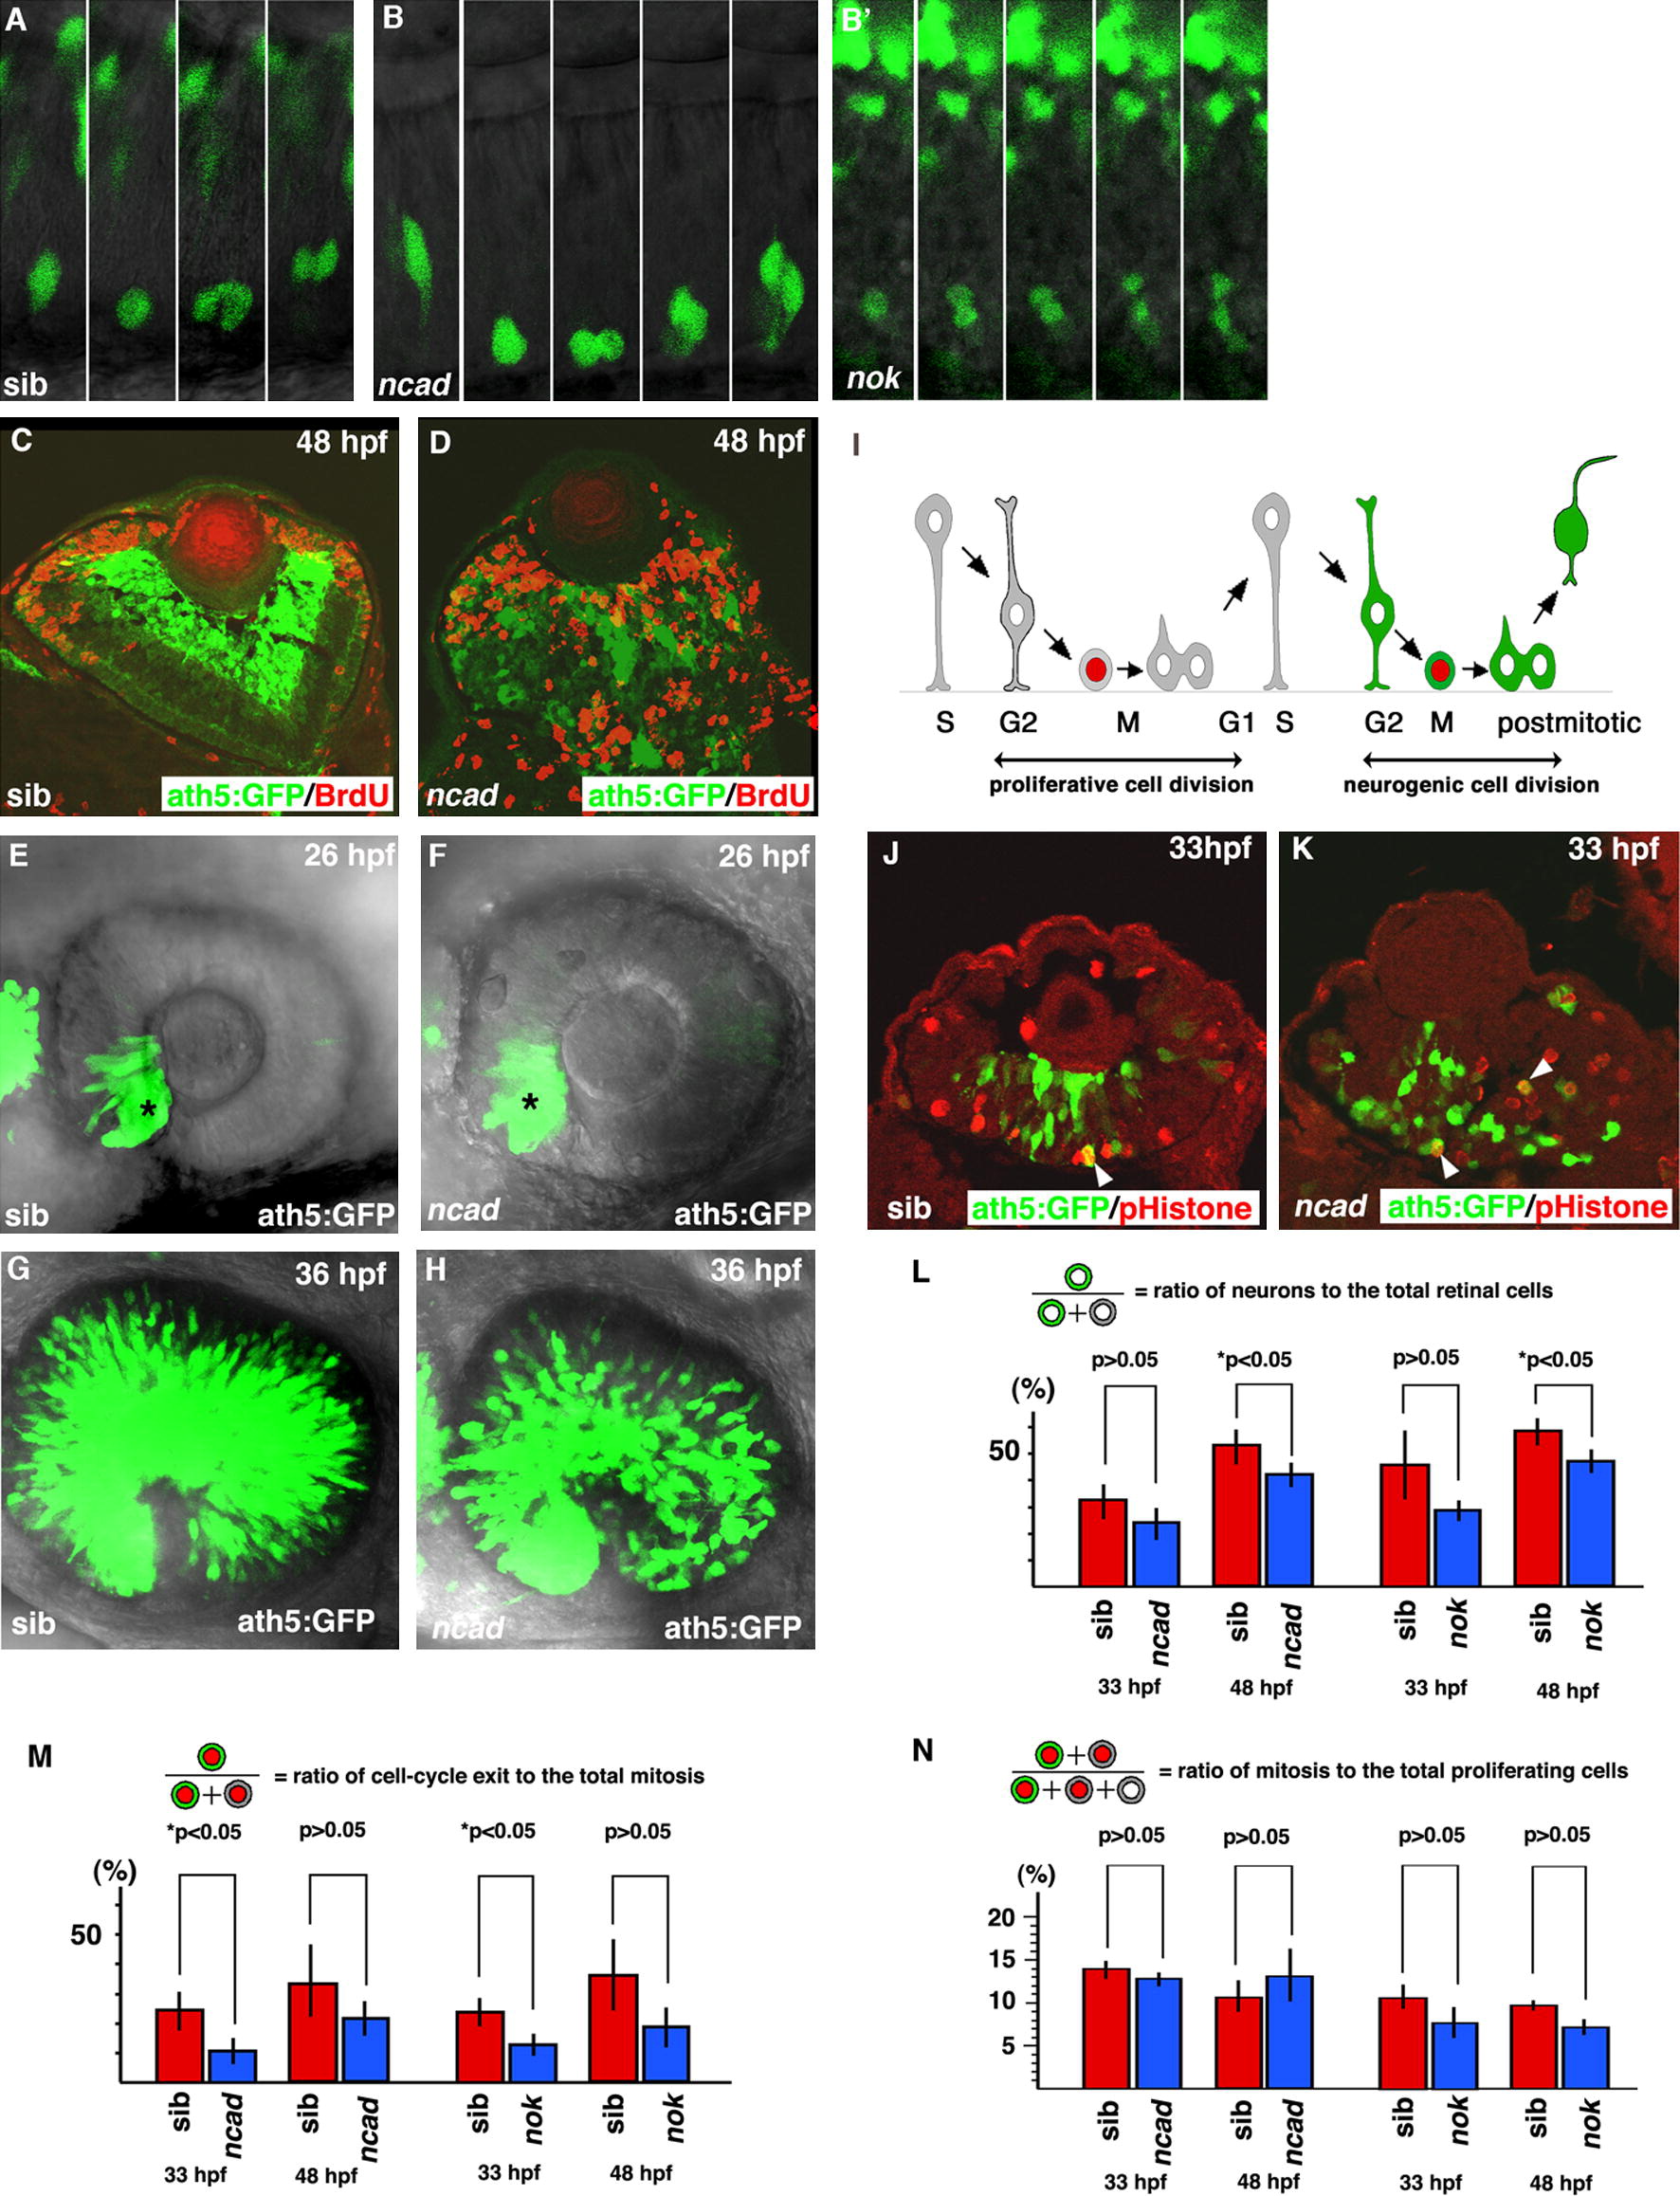
Fig. 3 Cell-cycle exit of retinal cells is compromised in ncad and nok mutants. (A, B, and B′) Time lapse images of ath5:GFP expression in wild-type retina (A), ncad (B) and nok (B′) mutant retinas from 30 (the leftmost panel) to 36 hpf (the rightmost panel). The apical surface of the retinal epithelium is positioned nearly at the bottom of each panel. ath5:GFP expression (green) is initiated in the G2 phase in retinal progenitor cells undergoing the final cell division and inherited by two post-mitotic daughter cells in wild-type embryos and ncad and nok mutant embryos. In the nok mutant retina shown in (B′), the cell-division plane was nearly perpendicular to the apicobasal direction, which is very rare in the wild type. (C and D) Double labeling of wild-type retina (C) and ncad mutant retina (D) with anti-BrdU antibody (red) and ath5:GFP (green). BrdU and ath5:GFP expressions do not overlap in both the wild-type retina and ncad mutant retina. (E and F) Expression of ath5:GFP in wild-type retina (E) and ncad mutant retina (F) at 26 hpf. The initial induction of ath5:GFP in the ventronasal retina (asterisks) occurs at almost the same stage as in the wild-type retina and ncad mutant retina. (G and H) ath5:GFP expression in the same pair of wild-type retina and ncad mutant retina shown in (E and F) at 36 hpf. ath5:GFP expression spreads similarly in ncad mutant retinas. (I) Schematic drawing of cell division, interkinetic nuclear migration, and molecular markers, ath5:GFP (green) and pH3 (red), in the neural retina. Retinal cells undergoing the neurogenic cell division are both ath5:GFP- and pH3-positive, whereas retinal cells undergoing the proliferative cell division are pH3-positive but ath5:GFP-negative. (J and K) Double labeling of wild type (J) and ncad mutant retinas (K) with anti-pH3 antibody (red) and ath5:GFP (green). Double positive cells are in yellow (arrowheads). (L) Percentage of ath5:GFP-positive cells with respect to total number of cells in wild-type retina and ncad and nok mutant retinas. The percentage is significantly decreased in these mutant retinas at 48 hpf (Student?s t-test, *p < 0.05). (M) Percentage of pH3- and ath5:GFP-double-positive cells with respect to total number of pH3-positive cells in wild-type retina and ncad and nok mutant retinas. The percentage is significantly decreased in ncad and nok mutant retinas at 33 hpf (Student?s t-test, *p < 0.05). (N) Percentage of pH3-positive cells with respect to total number of ?pH3-positive cells plus ath5:GFP- and pH3-double-negative cells? in wild-type retina and ncad and nok mutant retinas. There is no significant difference between wild-type retinas and these mutant retinas (Student?s t-test, p > 0.05).
Reprinted from Mechanisms of Development, 127(5-6), Yamaguchi, M., Imai, F., Tonou-Fujimori, N., and Masai, I., Mutations in N-cadherin and a Stardust homolog, Nagie oko, affect cell-cycle exit in zebrafish retina, 247-264, Copyright (2010) with permission from Elsevier. Full text @ Mech. Dev.

