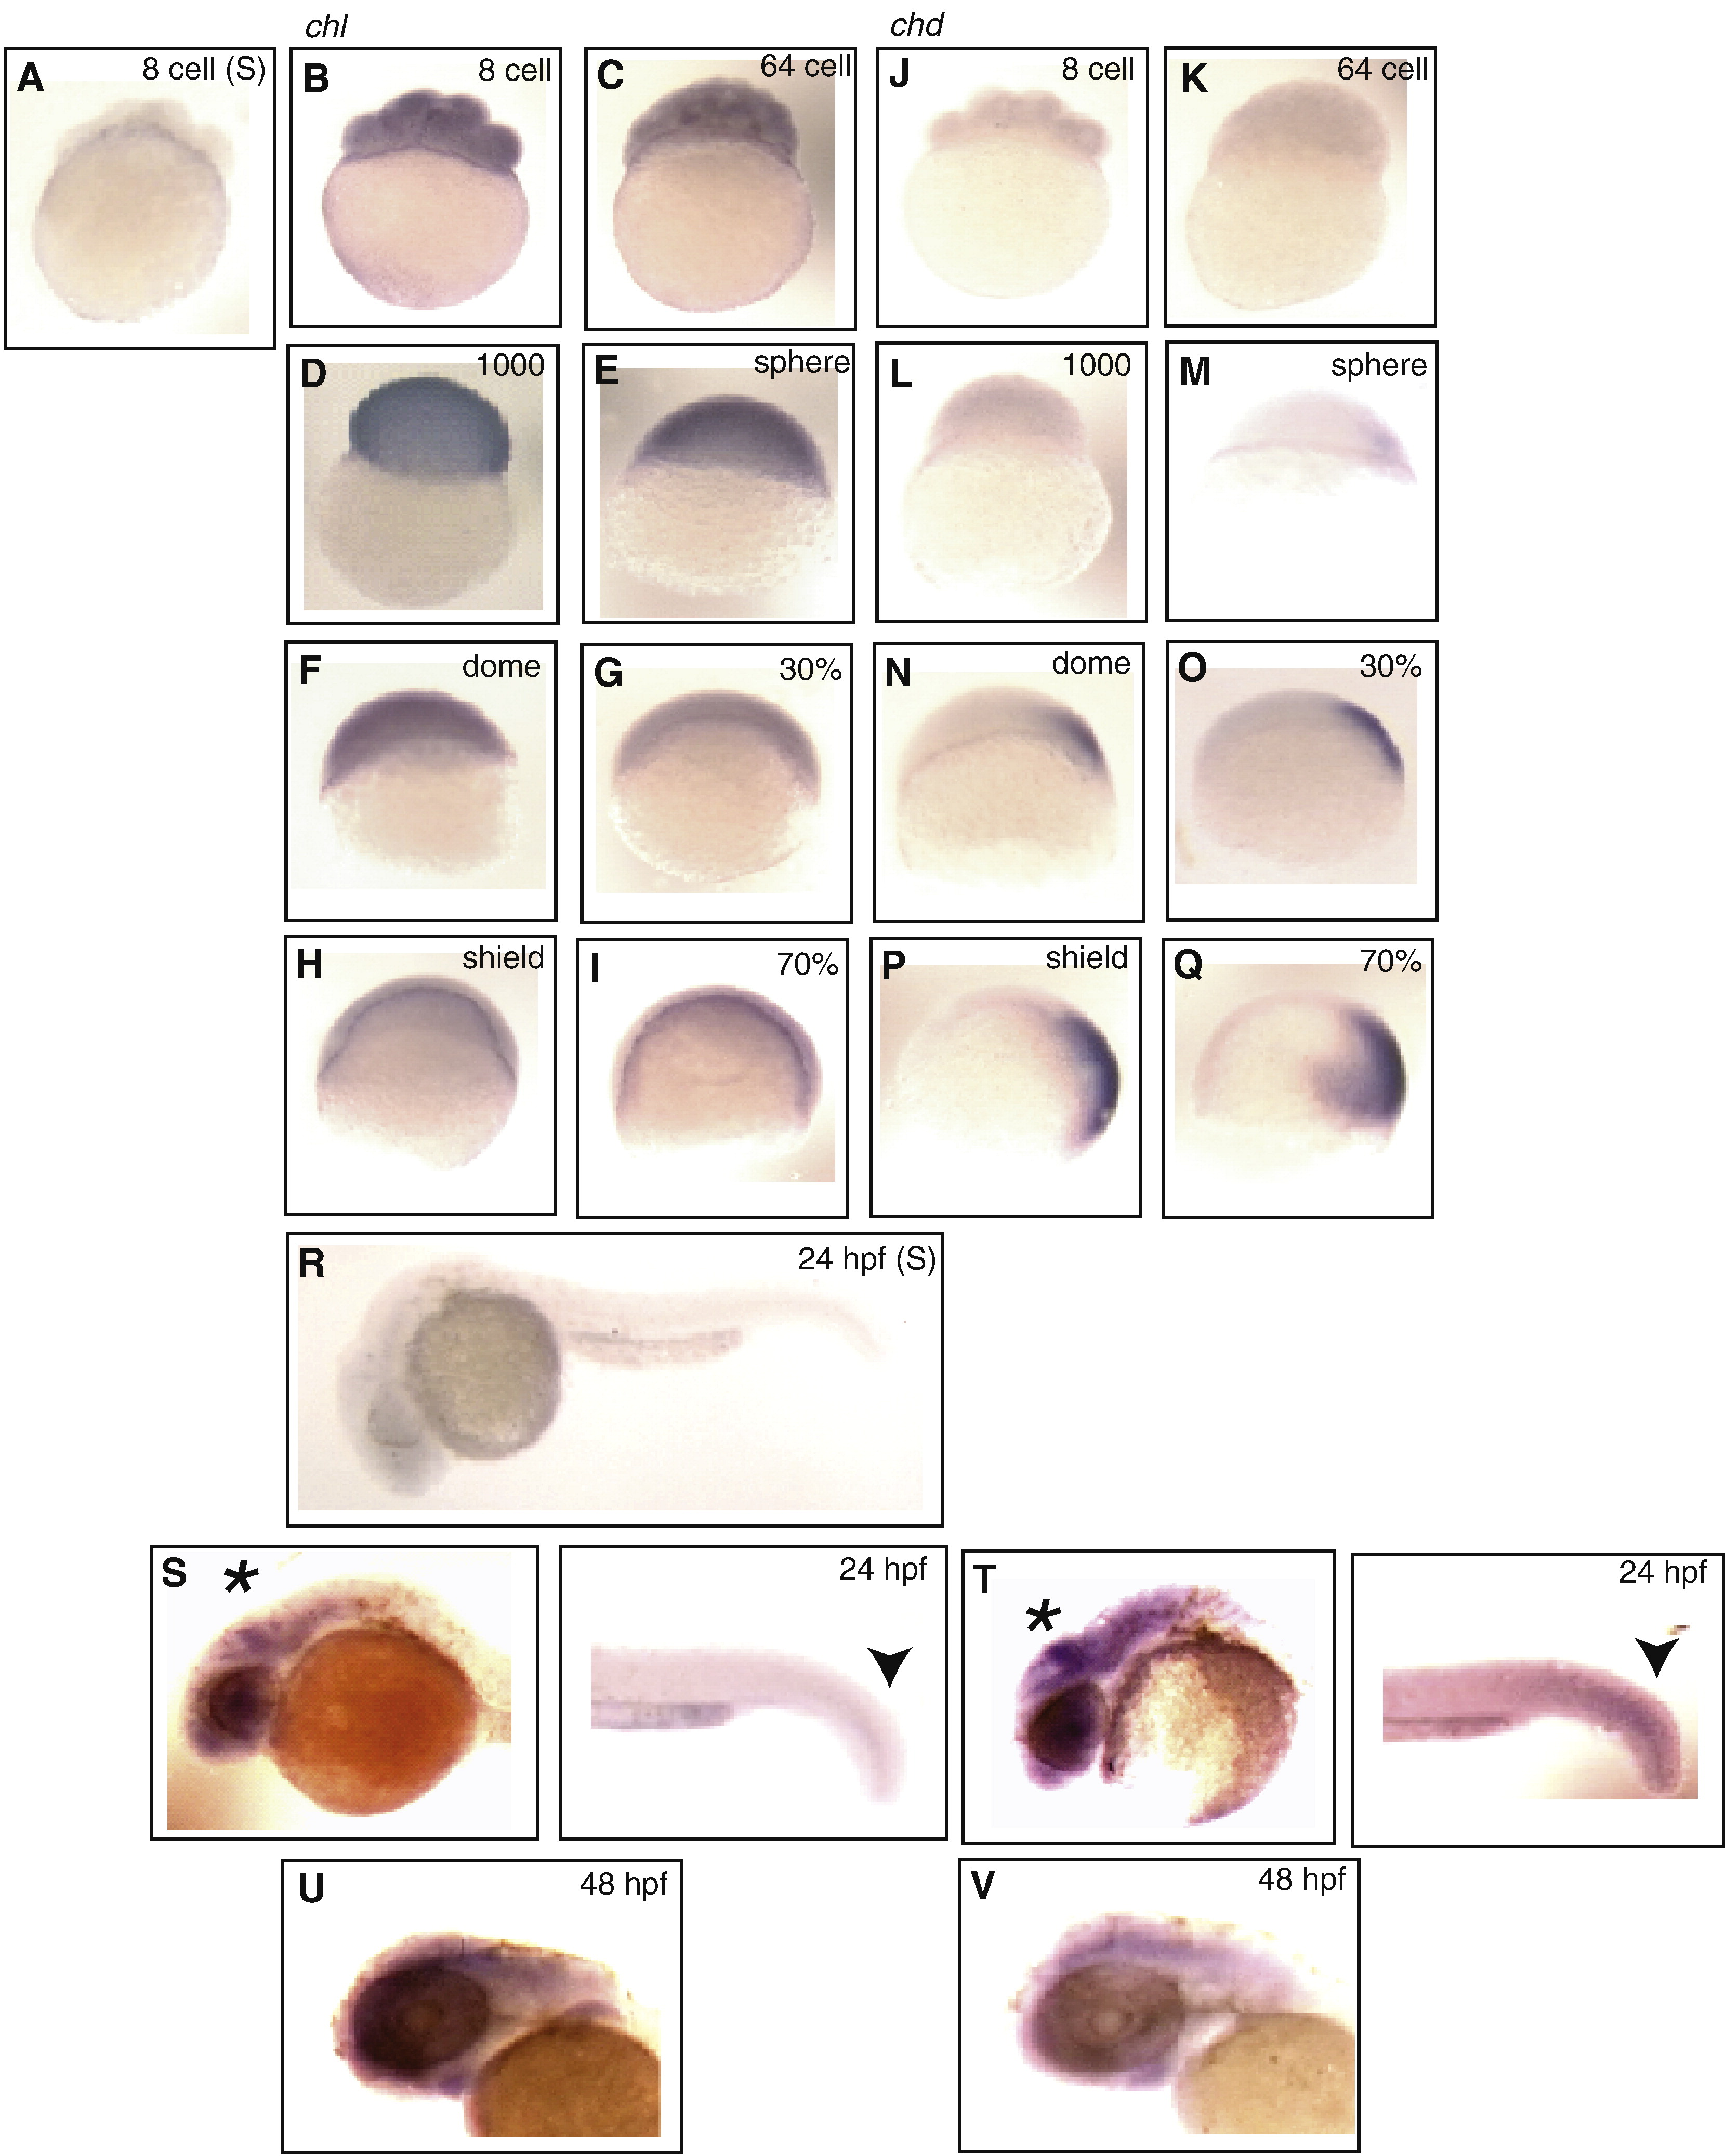
Fig. 3 Comparison of the spatial distributions of Chl and Chd expression during embryogenesis. Whole-mount in situ hybridization compares the spatial distribution patterns of Chl (B?I) and Chd expression (J?Q) in 8-cell stage through 70% epiboly embryos. (A) Eight-cell embryo hybridized with a sense Chl control probe. Anti-sense probes were hybridized to (B and J) 8-cell, (C and K) 64-cell, (D and L) 1000-cell, (E and M) sphere stage, (F and N) dome stage, (G and O) 30% epiboly, (H and P) shield stage, and (I and Q) 70% epiboly embryos. (R) The 24-hpf embryo hybridized with a sense Chl control probe. Signal resulting for hybridization to anti-sense probes for Chl (S and U) and Chd (T and V) is shown for 24 hpf (S and T) and the head regions of 48 hpf (U and V) embryos. Arrowheads mark overlapping Chl and Chd signals in 24-hpf tailbud. Asterisks mark midbrain and hindbrain structures enriched for both Chl (S) and Chd (T) signal at 24 hpf. Similar overlapping signals for Chl (U) and Chd (V) are evident in the brains of 48-hpf embryos.
Reprinted from Developmental Biology, 341(2), Branam, A.M., Hoffman, G.G., Pelegri, F., and Greenspan, D.S., Zebrafish Chordin-like and Chordin Are Functionally Redundant in Regulating Patterning of the Dorsoventral Axis, 444-458, Copyright (2010) with permission from Elsevier. Full text @ Dev. Biol.

