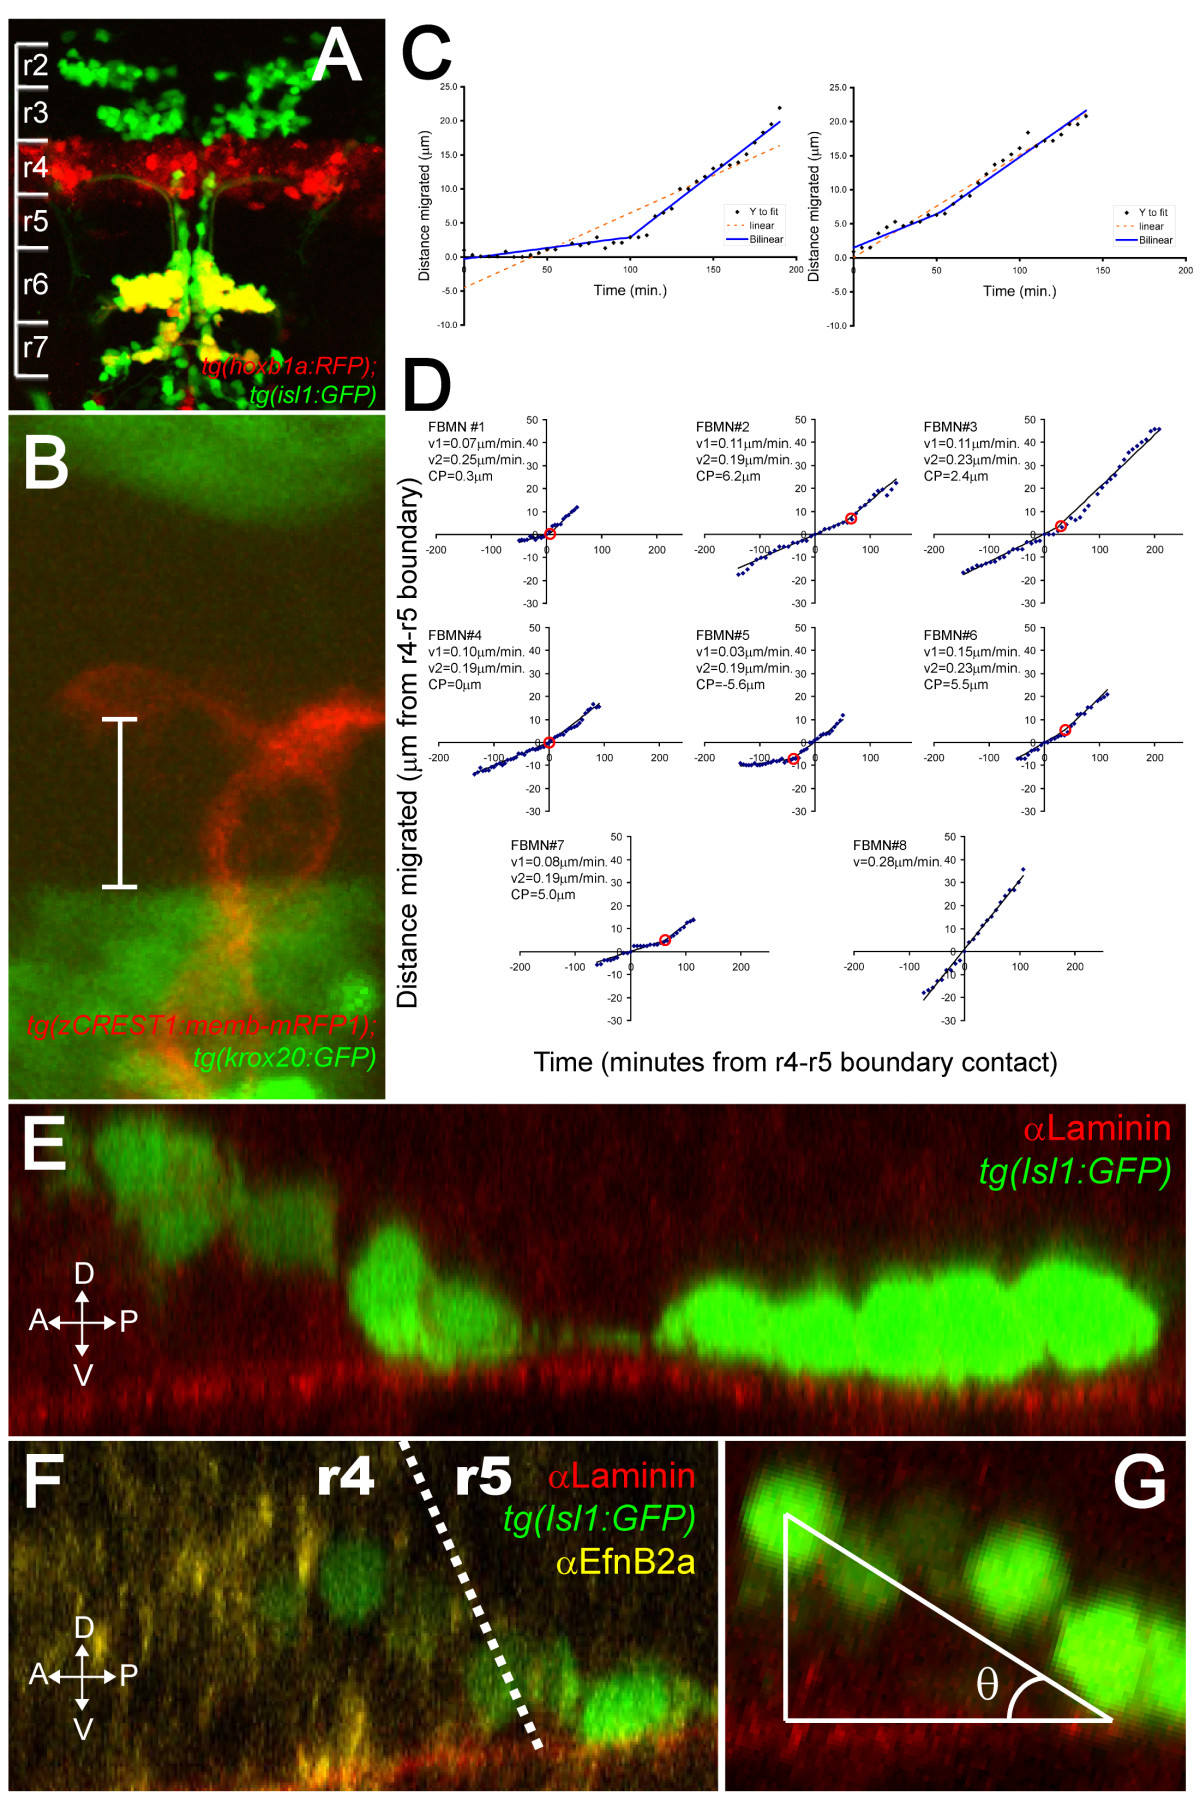
Fig. 1 FBMNs undergo a change in velocity upon contact with the Laminin-containing ventral basement membrane. (A) A maximum intensity projection of a confocal Z-stack of a tg(hoxb1aBAC:mRFP1); tg(isl1:GFP) double transgenic embryo at 48 hpf reveals that most Isl1:GFP positive neurons in both r6 and r7 are also hoxb1a:RFP positive, indicating that they were born in r4. (B) A single XY section of a tg(zCREST1:memb-mRFP1);tg(krox20BAC:GFP) double transgenic embryo at approximately 24 hpf showing the measurement from the posteriormost extent of the FBMN cell body to the r4-r5 boundary (white bar). (C) Plots of the extent of migration of single FBMNs versus time elapsed generated from timelapse movies of a tg(zCREST1:memb-mRFP1);tg(krox20BAC:GFP) double transgenic embryo starting at approximately 24 hpf. In the left graph, points are best fit by a bilinear model rather than a single line, indicating that the FBMN undergoes a single change in velocity while the right graph is equally well fit by either model, indicating a constant velocity. (D) Plots of extent of migration versus time re-centered so that the origin of the graph corresponds to the point of contact with the r4-r5 boundary (negative timepoints and distances indicate migration through r4 while positive timepoints and distances indicate migration through r5). FBMN#1 to FBMN#7 are those best fit by a bilinear model while FBMN#8 is an example of one best fit by a single line. CP, changepoint, the point at which the slope changes in the bilinear model (red circle); v1, initial slope; v2, slope after changepoint. (E-G) Reconstructed YZ sections through 24-hpf isl1:GFP embryos stained for Laminin (E) or Laminin (red) and α Efnb2a (yellow) (F) reveal that FBMNs undergo a ventral migration in r4 and come into close apposition with the basement membrane just after crossing the r4-r5 boundary, after which point their migration is purely posterior. (G) The angle of the ventroposterior early migration with respect to the basement membrane (θ) is measured by defining a right triangle with vertices at the middle of the anteriormost cell, the point of contact with the basement membrane and the basement membrane as one of the legs.
Image
Figure Caption
Acknowledgments
This image is the copyrighted work of the attributed author or publisher, and
ZFIN has permission only to display this image to its users.
Additional permissions should be obtained from the applicable author or publisher of the image.
Full text @ Neural Dev.

