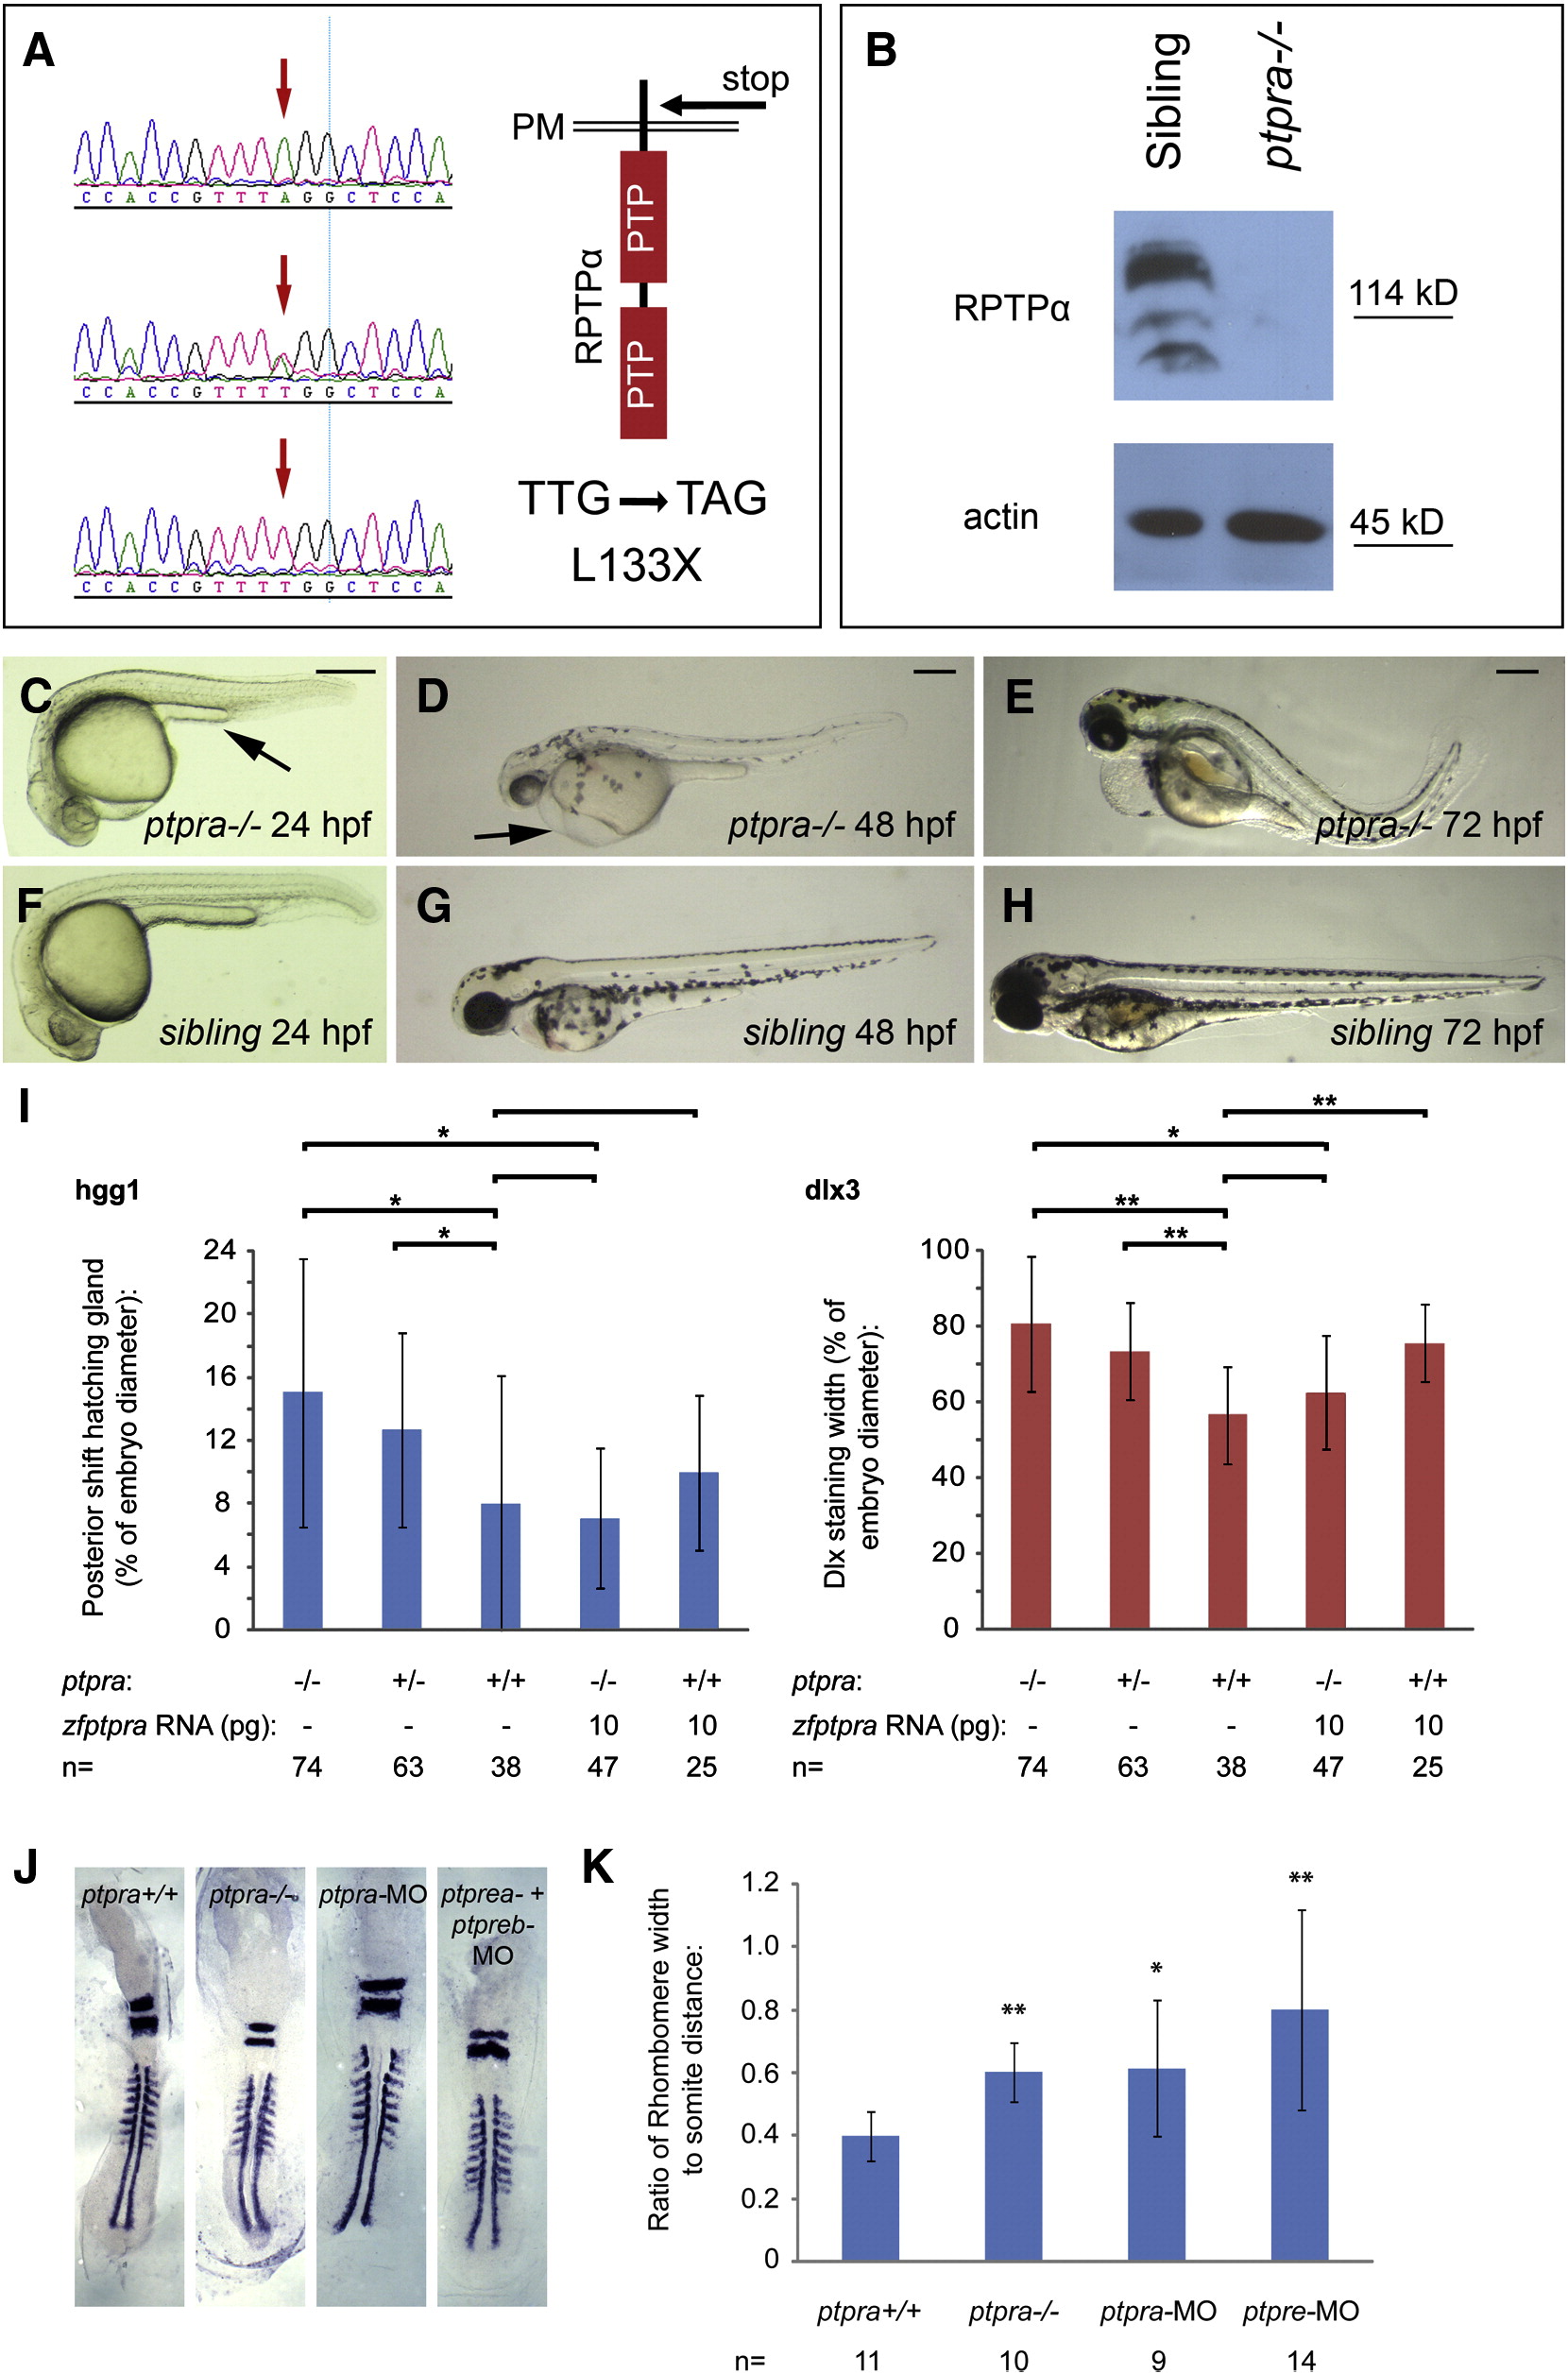
Fig. 4 A ptpra stop mutation phenocopied the ptpra knockdown and can be rescued by zf-ptpra mRNA. (A) A ptpra mutant (hu3334) was identified by target selected gene inactivation. Homozygous mutant (top), heterozygous (middle) and wildtype (bottom) sequences are depicted here and the TTG to TAG codon change resulting in a L133X stop in the extracellular domain is indicated. (B) Heterozygous ptpra+/- fish were in-crossed and their offspring was grown to 52 hpf. Embryos were characterized as mutant or sibling based on observed phenotype, dechorionated, deyolked and lysed using sodium orthovanadate and protease inhibitors. The resulting lysates were analyzed for RPTPα expression. Actin expression was monitored as a loading control. Heterozygous ptpra+/- fish were in-crossed and offspring embryos were photographed and genotyped at 24 hpf (C, F), 48 hpf (D, G) and 72 hpf (E, H). Mutants (A–C) and siblings (D–F) are shown. (I) Heterozygous ptpra+/- fish were in-crossed and embryos were either grown to 1 somite stage and fixed without injection, or micro-injected at the one cell stage with 10 pg/embryo zf-ptpra mRNA and then grown to 1 somite stage and fixed. Whole mount in situ staining was performed using probes for dlx3 and hgg1. The resulting staining patterns were analyzed by measuring the posterior shift of the hatching gland and the width of the dlx3 staining as described in Fig. 2H. After pictures were taken embryos were lysed and genotyped. The average posterior shift of the hatching gland (hgg1) or width of the dlx3 staining is plotted as a percentage of the embryo (yolk) diameter. (J) Heterozygous ptpra+/- fish were in-crossed and embryos were grown to 8 somite stage and fixed, or wildtype embryos were micro-injected at the one cell stage with 0.3 ng/embryo ptpra-MO or ptpre-MO and then grown to 8 somite stage and fixed. Whole mount in situ staining was performed using probes for krox20 and myod. The resulting staining patterns were analyzed by measuring the rhombomere width and the distance from the 1st to the 8th somite. Ptpra incross embryos were subsequently genotyped. For each group a representative embryo is shown. The rhombomere width and the distance from the 1st to the 8th somite were measured. The resulting ratio was plotted (K). Mutant and knockdown embryos were compared to wildtype embryos. Error bars in all graphs indicate standard deviations, Student t-tests were performed (2 tailed, assuming unequal variance) between indicated groups where ** indicates a P-value < 0.001, * a P-value < 0.05 and no asterisk indicates no significant difference, P-value > 0.05. Scale bars = 250 μm.
Reprinted from Developmental Biology, 340(2), van Eekelen, M., Runtuwene, V., Overvoorde, J., and den Hertog, J., RPTPalpha and PTPepsilon Signaling via Fyn/Yes and RhoA is Essential for Zebrafish Convergence and Extension Cell Movements during Gastrulation, 626-639, Copyright (2010) with permission from Elsevier. Full text @ Dev. Biol.

