
|
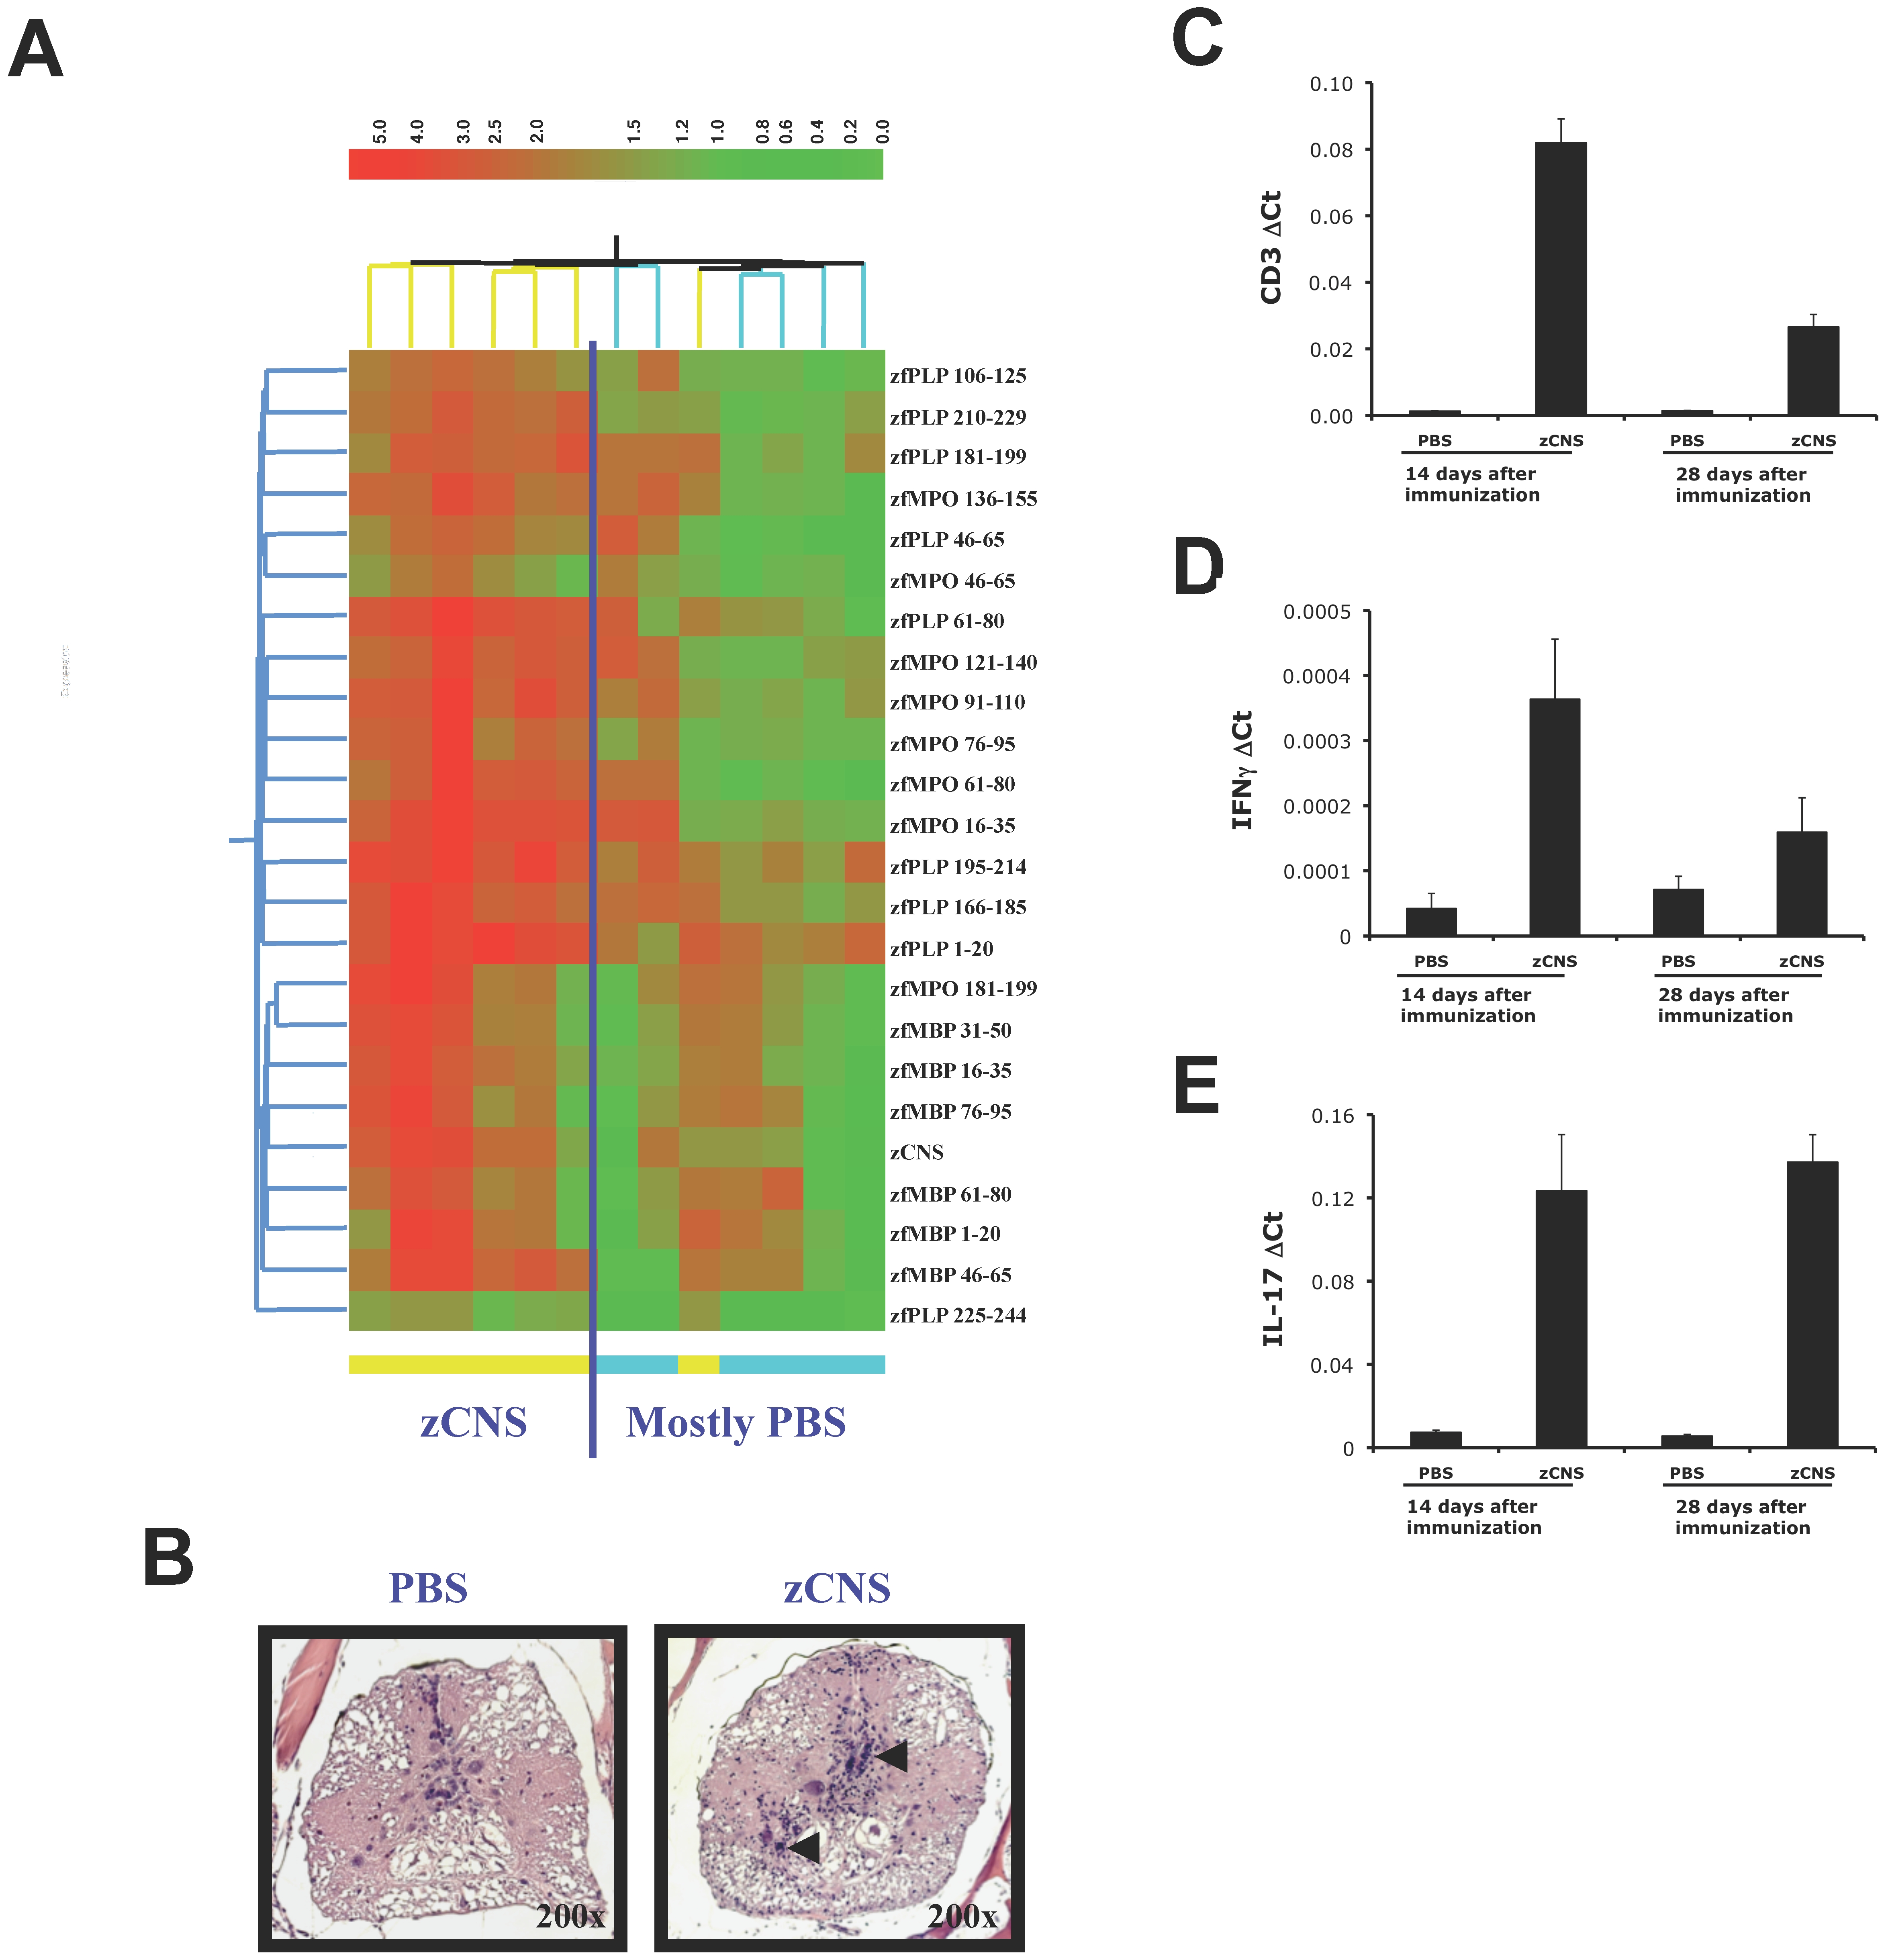
Fig. 1 Adaptive autoimmunity in zebrafish.
(A) Heatmap depicting the autoantibody response to myelin antigens on day 28 after immunization with zCNS or PBS in CFA. Each column represents a serum sample, color-coded at the bottom to indicate whether it corresponds to a zCNS or a control immunized sample. Only significantly up-regulated antibody reactivities are shown (n = 8, t-test FDR <0.05), according to the colorimetric scale on the right. (B-E) Zebrafish were immunized with zCNS or PBS in CFA and 14 or 28 days later the expression of CD3, IL-17 and IFNγ in brain was measured by real time PCR (mean + s.d. of triplicates) (B-D) or analyzed histologically for the presence of cell infiltrates (E). Two independent experiments produced similar results.