Image
Figure Caption
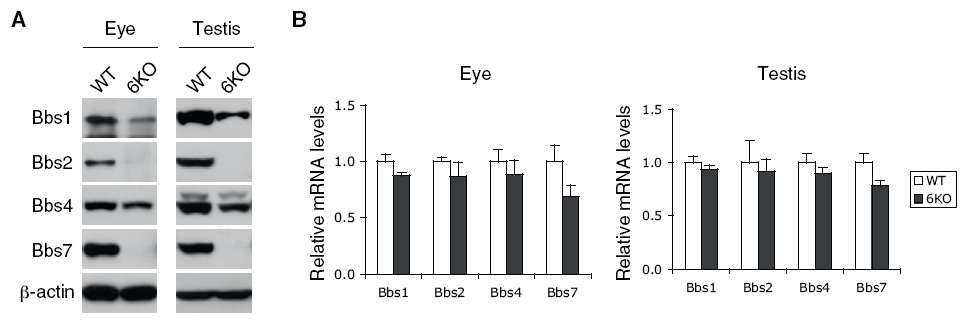
Fig. S3 Expression levels of BBS genes in Bbs6 null mouse tissues. (A) Amounts of BBS proteins (Bbs1, Bbs2, Bbs4, and Bbs7) in the eye and testis. Eye and testis extracts from wild-type and Bbs6 null mice were subjected to SDS/PAGE and immunoblotting. (B) Total RNA was extracted from wild-type and Bbs6 null eye and testis, and mRNA levels of Bbs1, Bbs2, Bbs4, and Bbs7 were compared by quantitative RT-PCR. Although there was a slight decrease in BBS gene expressions in Bbs6 null tissues, the difference was not significant.
Acknowledgments
This image is the copyrighted work of the attributed author or publisher, and
ZFIN has permission only to display this image to its users.
Additional permissions should be obtained from the applicable author or publisher of the image.
Open Access.
Full text @ Proc. Natl. Acad. Sci. USA

