
Image
|
Figure Caption
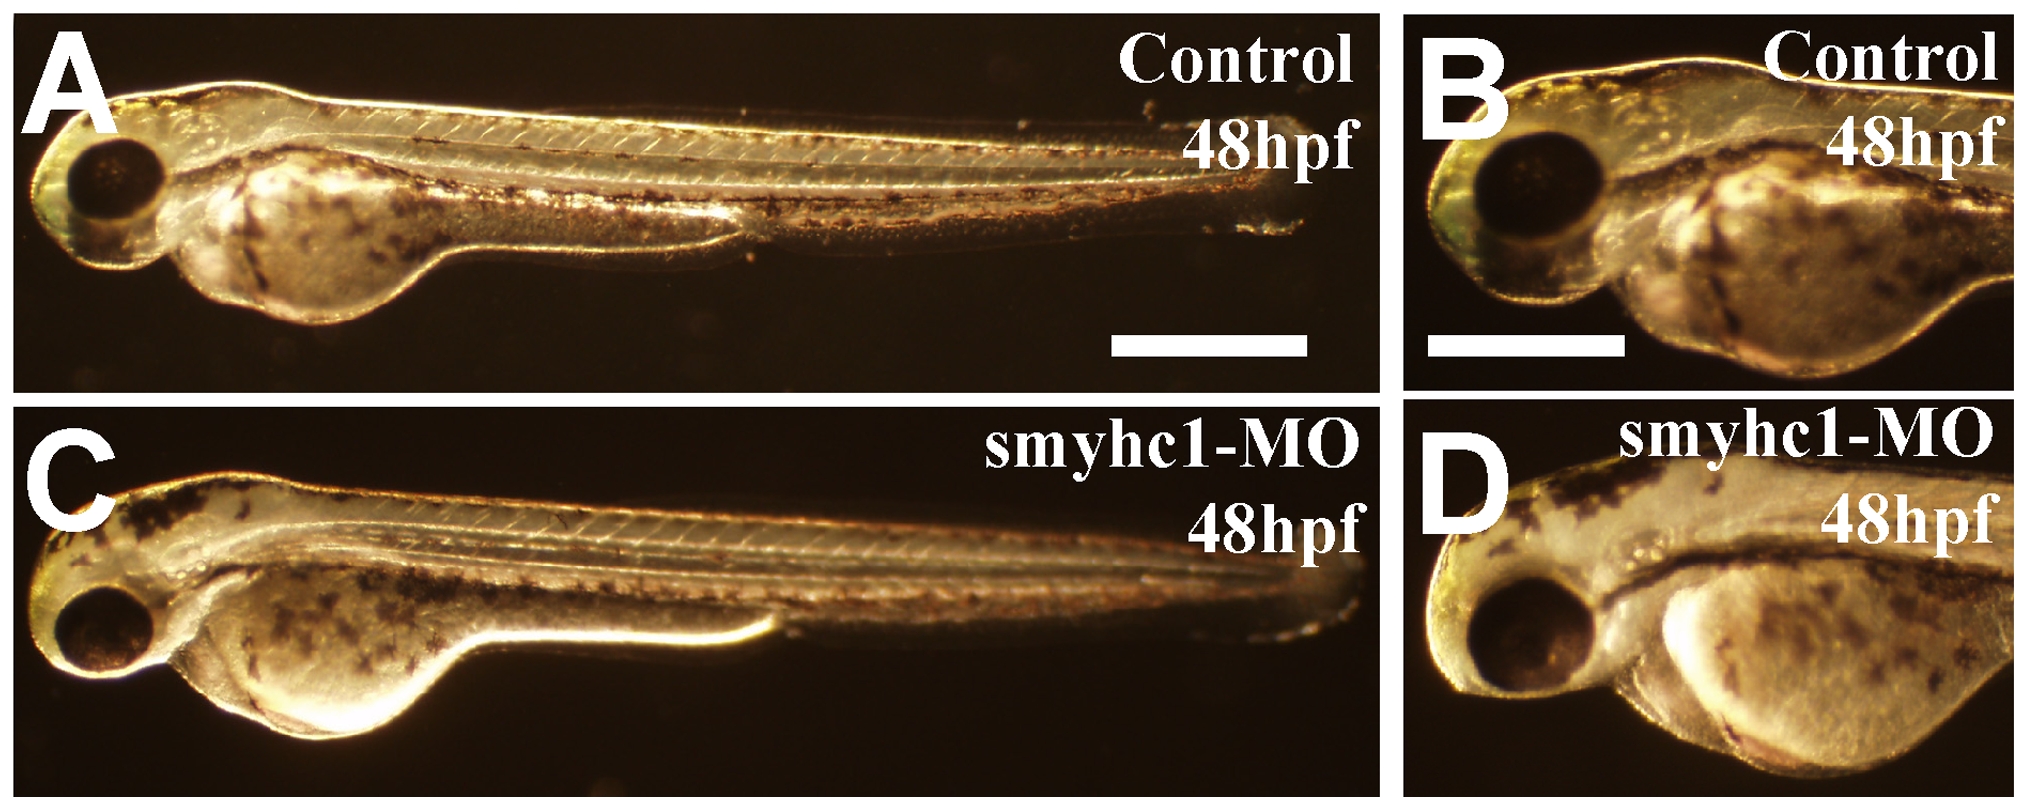
Fig. 3 Morphology of control and smyhc1 knockdown embryos at 48 hpf.
Morphological comparison of control (C, D) or smyhc1-ATG-MO injected (E, F) embryos at 48 hpf. Scale bars = 30μm in A, 100 μm in C and D.
Figure Data
Acknowledgments
This image is the copyrighted work of the attributed author or publisher, and
ZFIN has permission only to display this image to its users.
Additional permissions should be obtained from the applicable author or publisher of the image.
Full text @ PLoS One