Image
Figure Caption
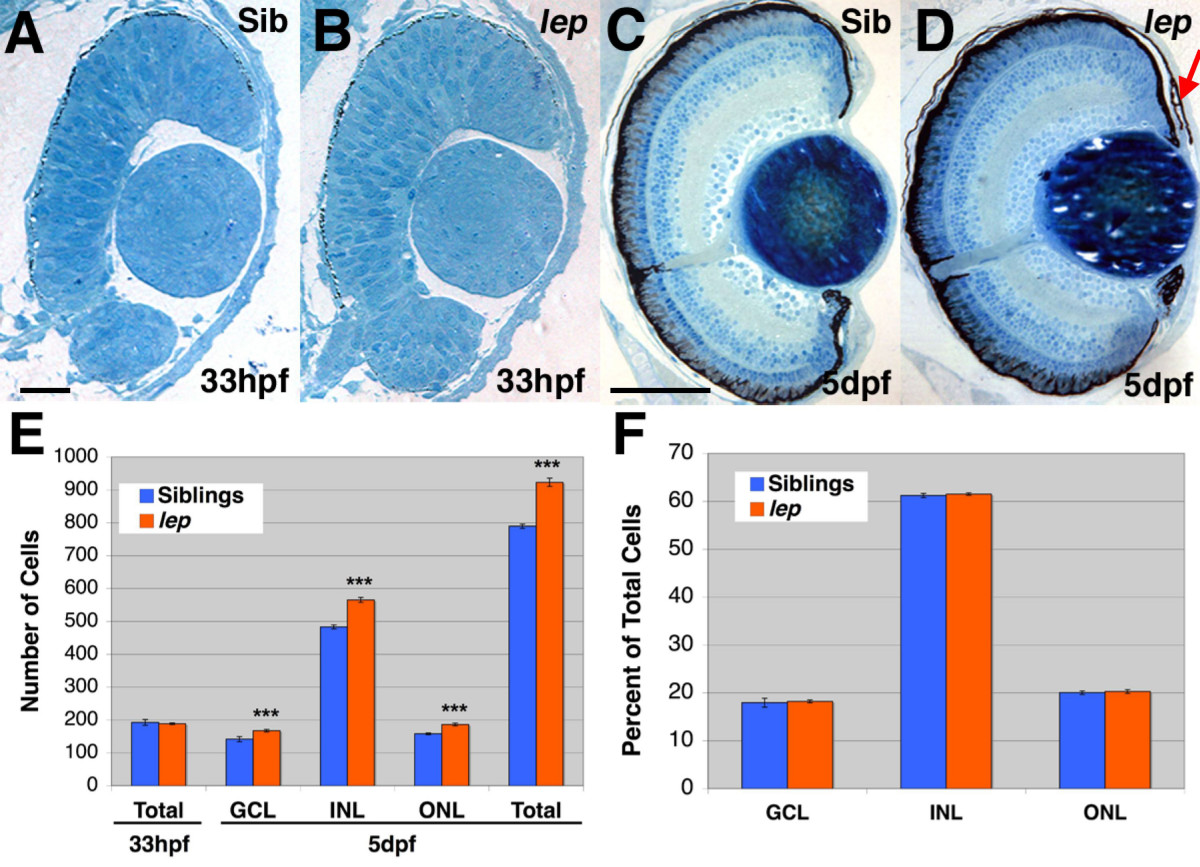
Fig. 2 lep/ptc2 mutant retinas possess proportional increases in cell numbers in all three nuclear layers. Histology of sibling (A, C) and lep/ptc2 mutant (B, D) retinas at 33hpf (A, B) and 5dpf (C, D). E) Quantification of total number of retinal cells at 33hpf and 5dpf, and of cells in each nuclear layer at 5dpf (18.0%, 17.0%, and 17.8% increases in GCL, INL, and ONL, respectively. ***p < 0.0001). F) Graph of the proportion of each nuclear layer as a percentage of total retinal cells at 5dpf. Scale Bars = 20 μm in A, B and 100 μm in C, D.
Figure Data
Acknowledgments
This image is the copyrighted work of the attributed author or publisher, and
ZFIN has permission only to display this image to its users.
Additional permissions should be obtained from the applicable author or publisher of the image.
Full text @ BMC Dev. Biol.

