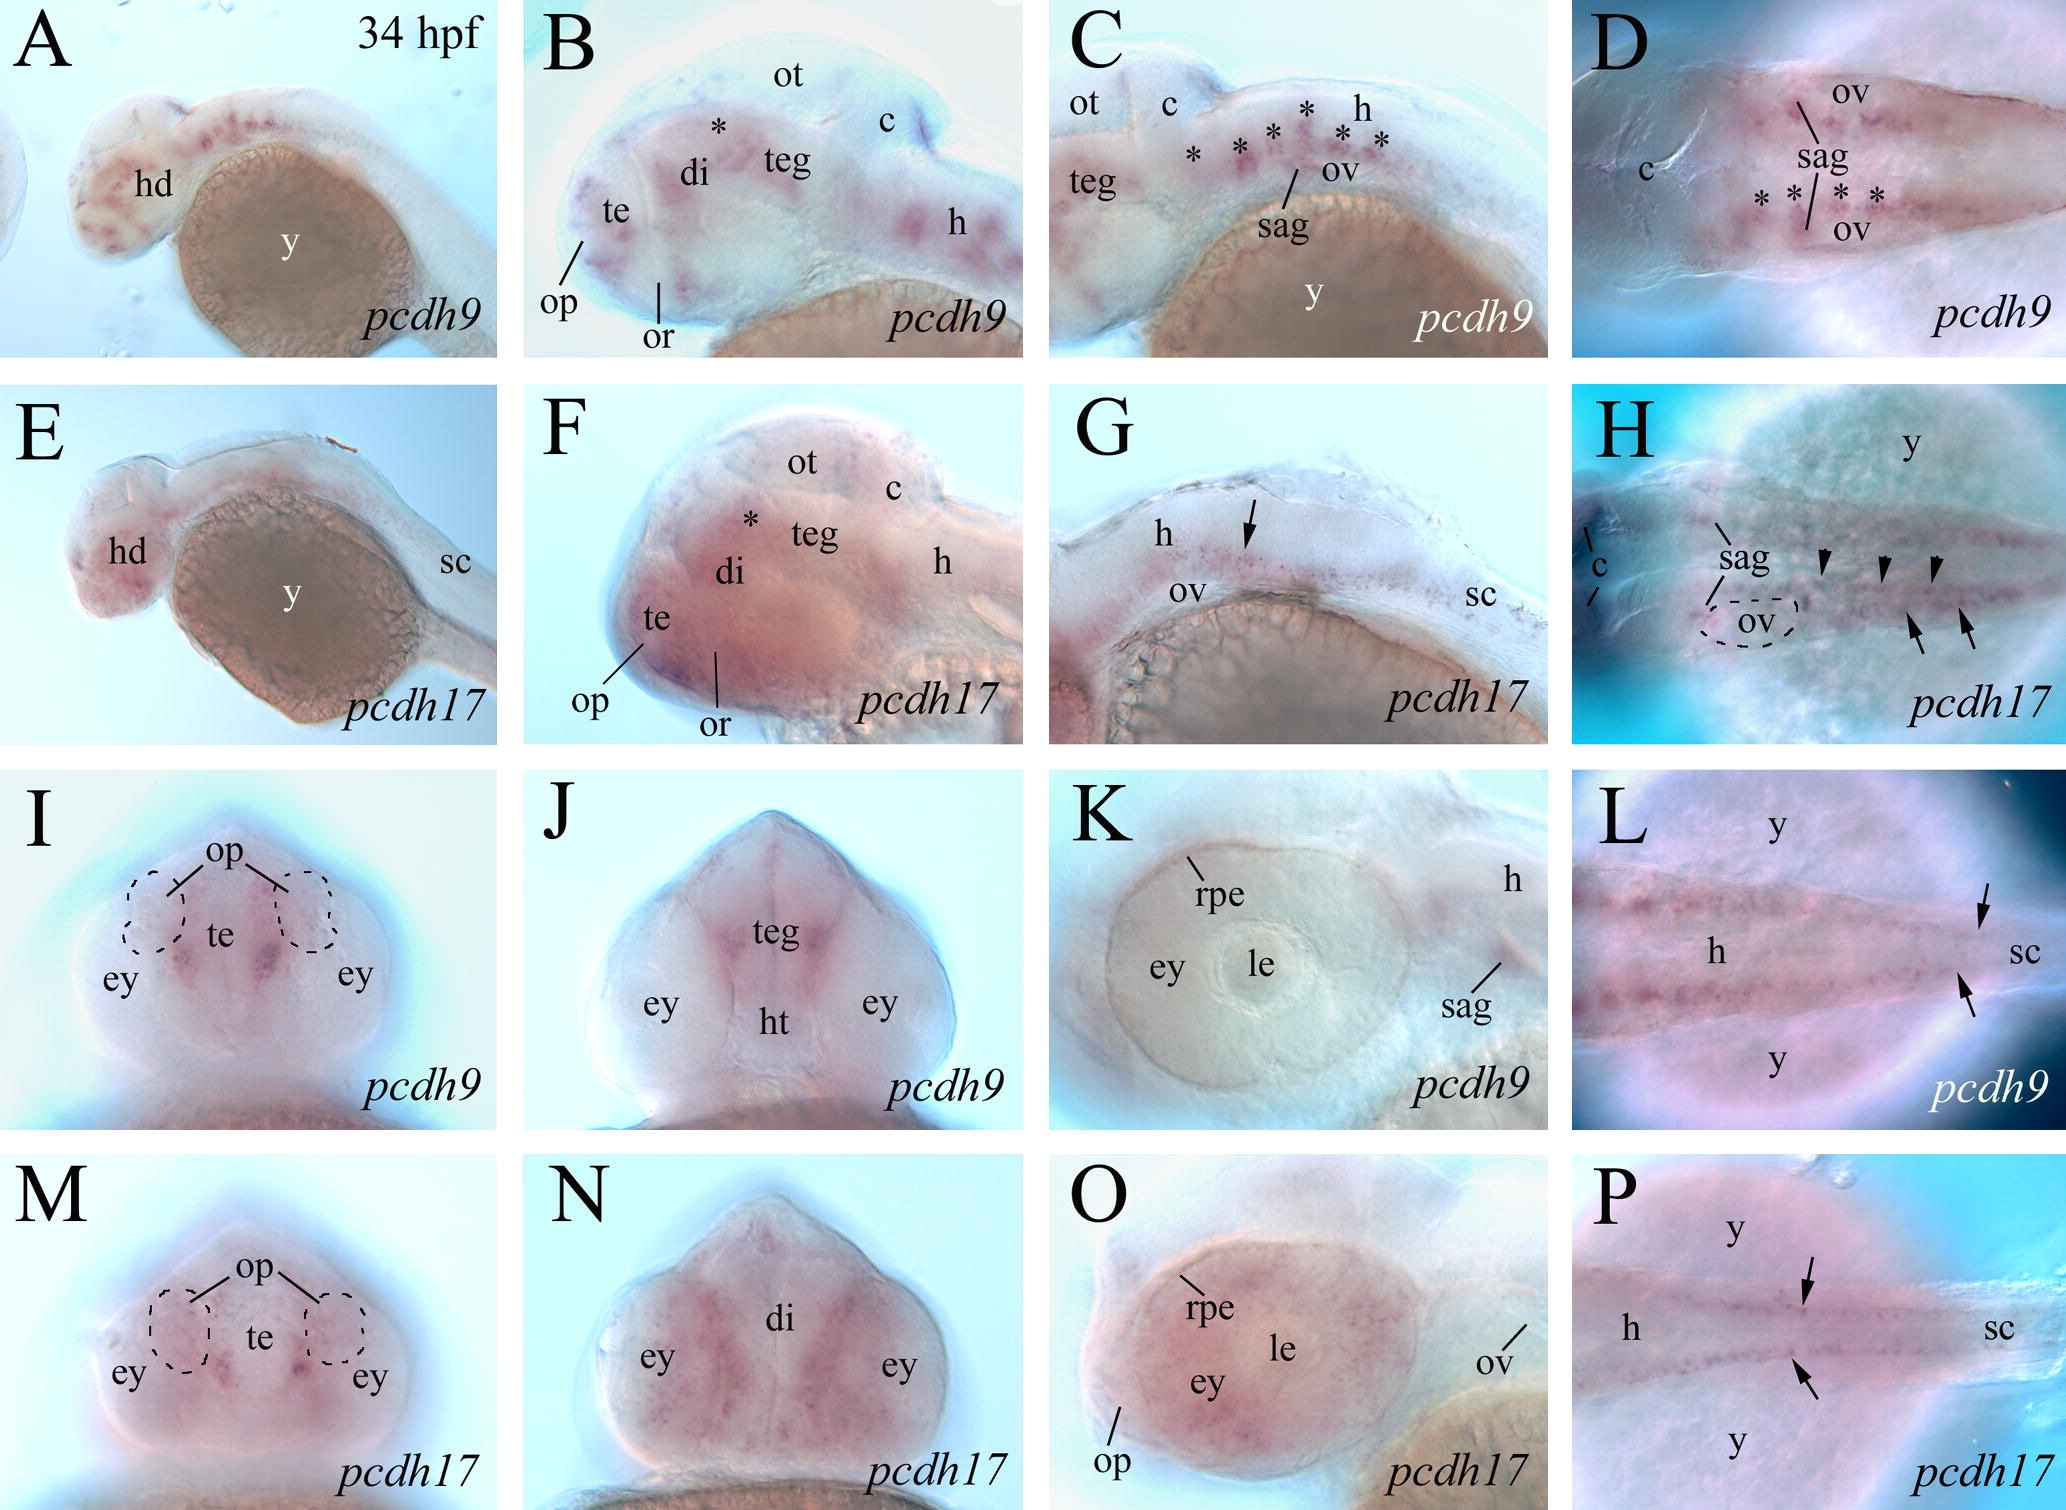
Fig. 5 Pcdh9 and Pcdh17 expression in 34 hpf embryos. All panels are from whole mount embryos labeled with Pcdh9 cRNA (A?D, I?L) or Pcdh17 cRNA (E?H, M?P) probes. (A and E) Lateral views (anterior to the left and dorsal up) of the anterior 2/3 of the embryos. (B and F) Lateral views (anterior to the left and dorsal up) of the fore- and midbrains, while (C and G) show lateral views of the hindbrain (C shows slightly more anterior structures). (D, H, L and P) Dorsal views (anterior to the left), with (D, H and L) showing mainly the hindbrain, while (P) showing mainly the spinal cord. (I and M) Frontal views (dorsal up) focusing at the telencephalon level, while (J and N) are frontal views (dorsal up) focusing at the diencephalon and tegmentum levels, respectively. (K and O) Lateral views (anterior to the left and dorsal up) of the retina. The asterisk in (B and F) indicates the pretectal area. Segmental expression of Pcdh9 in the hindbrain is indicated by asterisks in (C and D). Abbreviations: ht, hypothalamus; op, olfactory placode. Other abbreviations are the same as in Fig. 4.
Reprinted from Gene expression patterns : GEP, 9(7), Liu, Q., Chen, Y., Pan, J.J., and Murakami, T., Expression of protocadherin-9 and protocadherin-17 in the nervous system of the embryonic zebrafish, 490-496, Copyright (2009) with permission from Elsevier. Full text @ Gene Expr. Patterns

