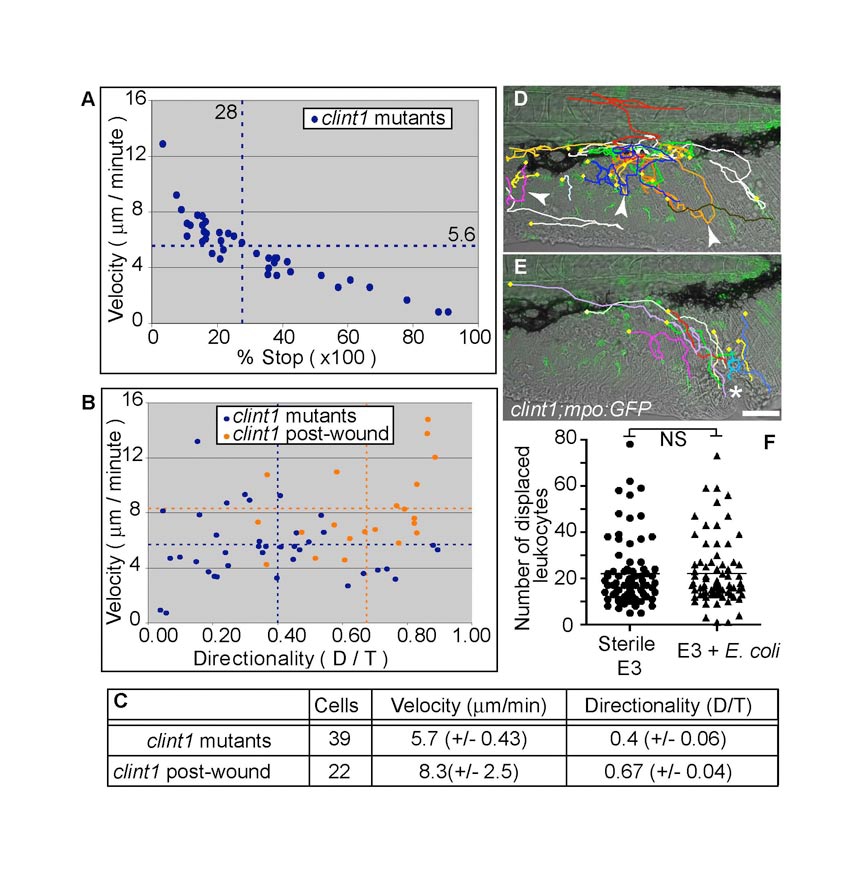
Fig. S2 Functional neutrophil behaviors in clint1 mutants. (A-C) Quantification of migratory characteristics of neutrophils in clint1;mpo:GFP mutants before (A-C; clint1 mutants) and after (B,C; clint1 post-wound) wounding. (A) Plot of average velocity (μm/minute) versus percentage of time stopped. (B) Plot of average velocity (μm/minute) versus directionality (D/T). Each data point indicates parameters for an individual neutrophil from three clint1;mpo:GFP embryos before (blue) and after (orange) wounding. Data were averaged per embryo and are represented by dashed lines. (C) Table summarizing neutrophil tracking data from time-lapse movies of clint1;mpo:GFP embryos before (clint1 mutants, D, see Movie 2) and after (clint1 post-wound, E, see Movie 3) wounding. Standard deviations are shown. (D,E) Total migration paths taken by neutrophils overlaid onto the first frame of representative movies. (D) Arrowheads identify bidirectional tracks. Yellow squares identify starts of tracks. (E) Asterisk identifies wound. (F) Quantification of leukocyte displacement in embryos raised in sterile E3 (circles) or sterile E3 with significant amounts of E. coli added (triangles). NS, not significant. Scale bars: 50 μm.
Image
Figure Caption
Acknowledgments
This image is the copyrighted work of the attributed author or publisher, and
ZFIN has permission only to display this image to its users.
Additional permissions should be obtained from the applicable author or publisher of the image.
Full text @ Development

