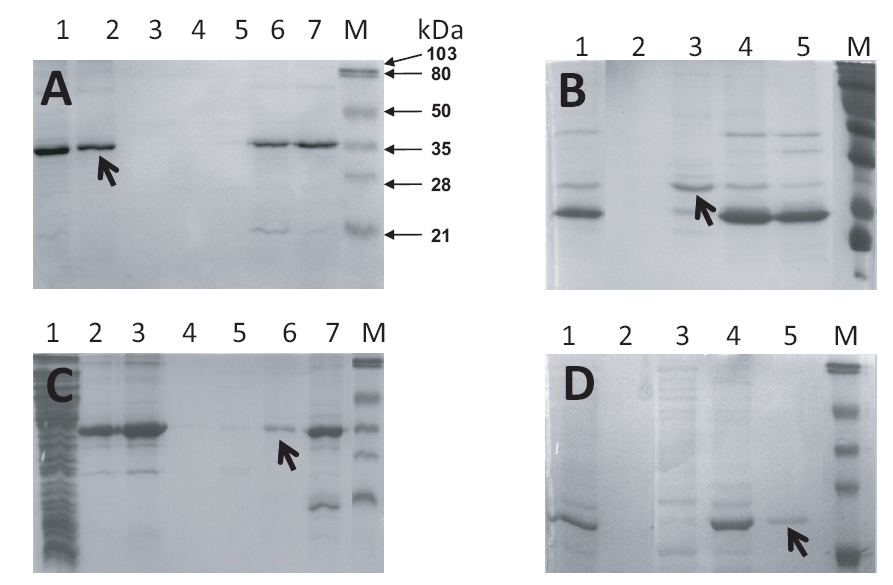
Fig. S15 SDS-PAGE gel pictures showing the production of recombinant zebrafish PRL1 (A and B) and PRL2 (C and D). (A) Lane 1: BL21 cell lysate; lane 2: column flow-through; lane 3: column wash with 50 mM PBS; lanes 4?7: column wash with 25 mM, 50 mM, 100 mM and 500 mM imidazole respectively. The arrow indicates the collected zfPRL1-SUMO fusion protein. (B) Lane 1: enzyme digestion mixture of zfPRL1-SUMO fusion protein by SENP1; lane 2: column wash with PBS; lanes 3?5: column wash with 50 mM, 100 mM and 500 mM imidazole respectively. The arrow indicates the collected zfPRL1 protein. (C) Lane 1: BL21 cell lysate; lane 2 column flow-through; lane 3: column wash with 50 mM PBS; lanes 4?7: column wash with 25 mM, 50 mM, 100 mM and 500 mM imidazole respectively. The arrow indicates the collected zfPRL2-SUMO fusion protein. (D) Lane 1: enzyme digestion mixture of zfPRL2-SUMO fusion protein by SENP1; lane 2: column flow-through; lanes 3-5: column wash with 20 mM, 50 mM, 100 mM imidazole respectively. The arrow indicates the collected zfPRL2 protein. M stands for protein markers used in the SDS-PAGE.
Image
Figure Caption
Acknowledgments
This image is the copyrighted work of the attributed author or publisher, and
ZFIN has permission only to display this image to its users.
Additional permissions should be obtained from the applicable author or publisher of the image.
Full text @ PLoS One

