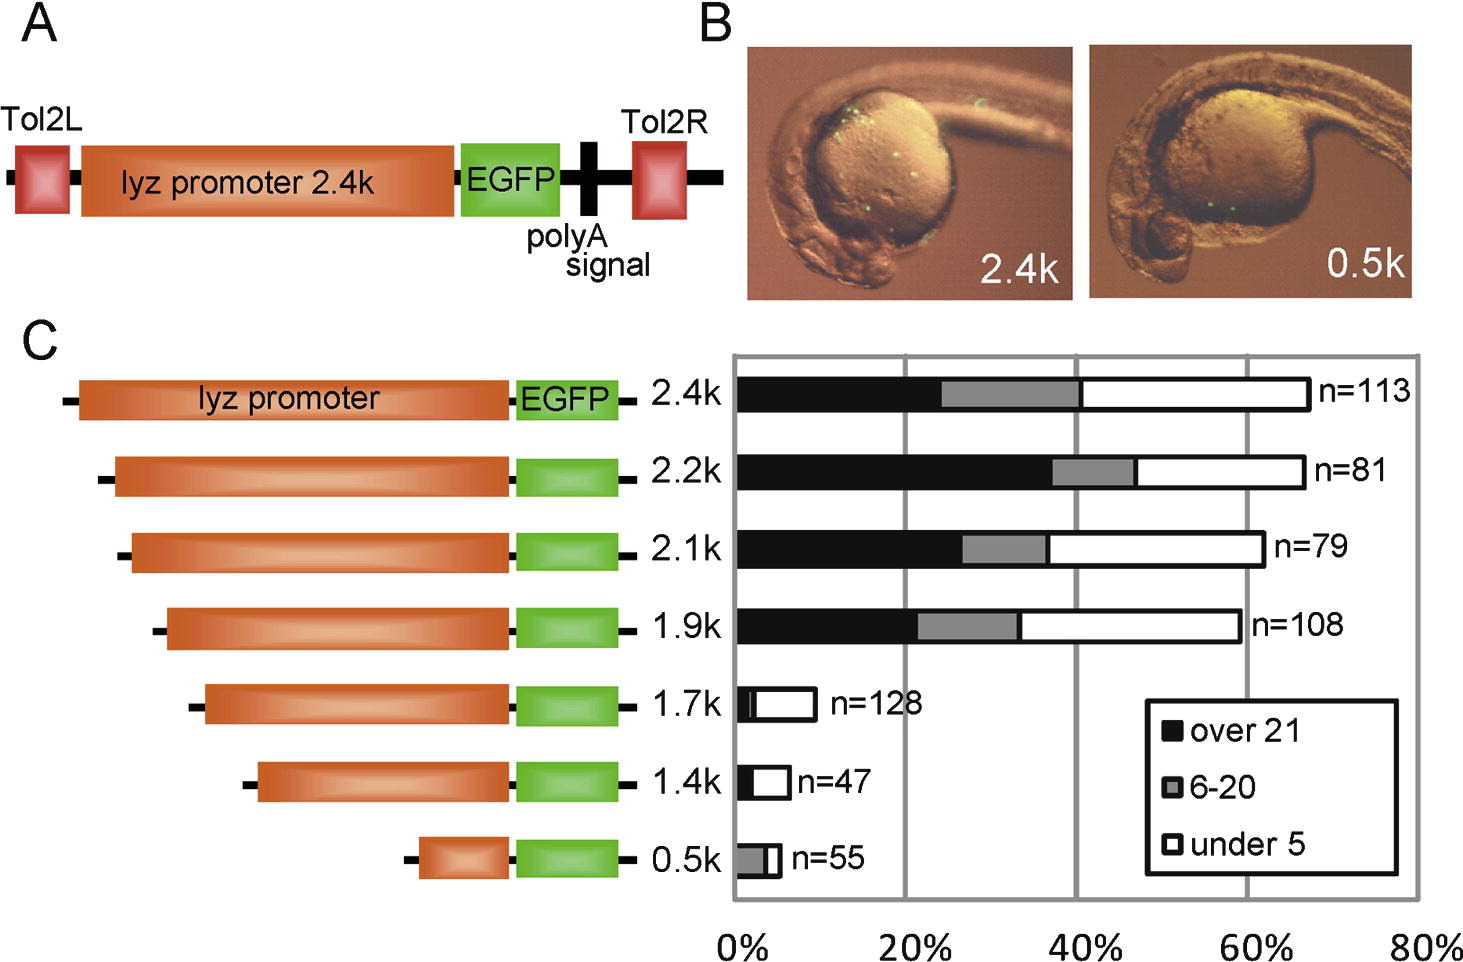
Fig. 1 Promoter analysis of zebrafish lyz gene using Tol2 transient expression system. (A) Schematic map of pTol-lyzP (2.4 kb)-EGFP. Tol2L and Tol2R indicate minimal Tol2 transposable elements. (B) Transient EGFP expression at 24 hpf. Lateral view; anterior is left. The reporter construct (pTol-lyzP [2.4 kb]-EGFP or pTol-lyzP [0.5 kb]-EGFP; 25 pg each) was co-injected with synthetic Tol2 transposase mRNA (25 pg) into one- or two-cell stage embryos, and transient EGFP expression was examined by fluorescent microscopy. A large number of EGFP-positive cells were detected in the 2.4 kb lyz promoter construct-injected embryo, while a small number of EGFP-positive cells were detected in the 0.5 kb promoter construct-injected embryo. (C) Schematic map of the lyz promoter deletion constructs and the summary of EGFP transient expression assay. Indicated reporter constructs (25 pg) were co-injected with Tol2 RNA (25 pg) into one- or two-cell stage embryos and EGFP-positive cells were counted at 24–26 hpf. The embryos were classified by EGFP-positive cell number into three categories: over 21 positive cells (over 21), 6–20 positive cells (6–20), under five positive cells (under 5). The percentage of each category is shown in the bar graph. The number of injected embryo is indicated at the right side in the graph.
Reprinted from Mechanisms of Development, 126(5-6), Kitaguchi, T., Kawakami, K., and Kawahara, A., Transcriptional regulation of a myeloid-lineage specific gene lysozyme C during zebrafish myelopoiesis, 314-323, Copyright (2009) with permission from Elsevier. Full text @ Mech. Dev.

