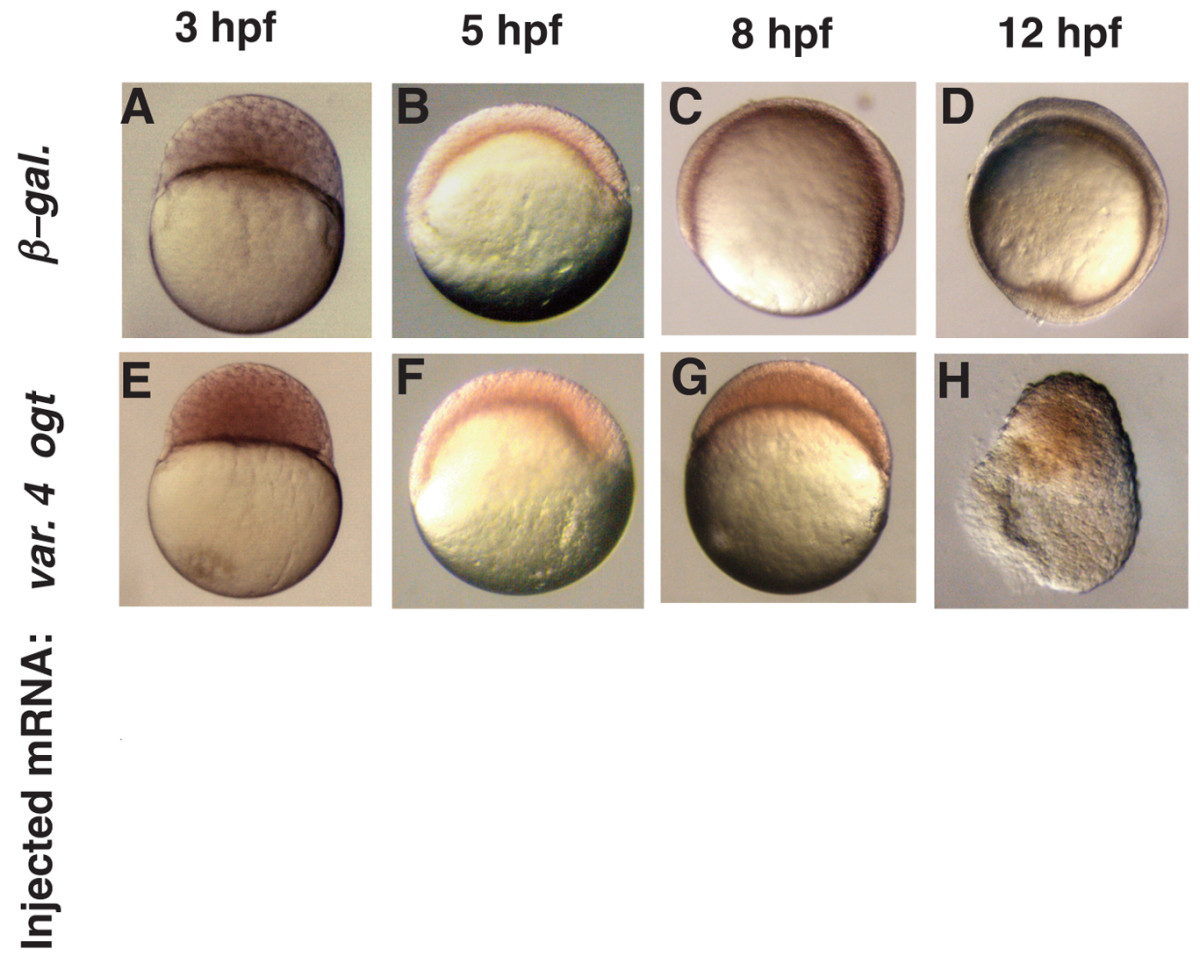
Fig. 9 Epiboly is delayed in Ogt expressing embryos. A live time-course embryonic development of an embryo injected with β-galactosidase mRNA (A-D) or a sibling injected with encoding variant 4 ogt mRNA (E-H) at 3 hpf (A, E), 5 hpf (B, F), 8 hpf (C, G) and 12 hpf (D, H). Progression through the cleavage stages in ogt overexpressing embryos (E) is indistinguishable from controls (E). Epiboly initiates normally when Ogt is overexpressed, and these embryos reach 40% epiboly at 5 hpf (B), the same as controls (F). Ogt overexpressing embryos are stalled at 40% epiboly at 8 hpf (G), when controls are at 75% epiboly (G). Control embryos complete epiboly at 10 hpf and reach the 3 somite stage at 12 hpf (D). The most severely affected Ogt overexpressing embryos never complete epiboly and begin to degenerate at 12 hpf (H).
Image
Figure Caption
Acknowledgments
This image is the copyrighted work of the attributed author or publisher, and
ZFIN has permission only to display this image to its users.
Additional permissions should be obtained from the applicable author or publisher of the image.
Full text @ BMC Dev. Biol.

