Fig. 2
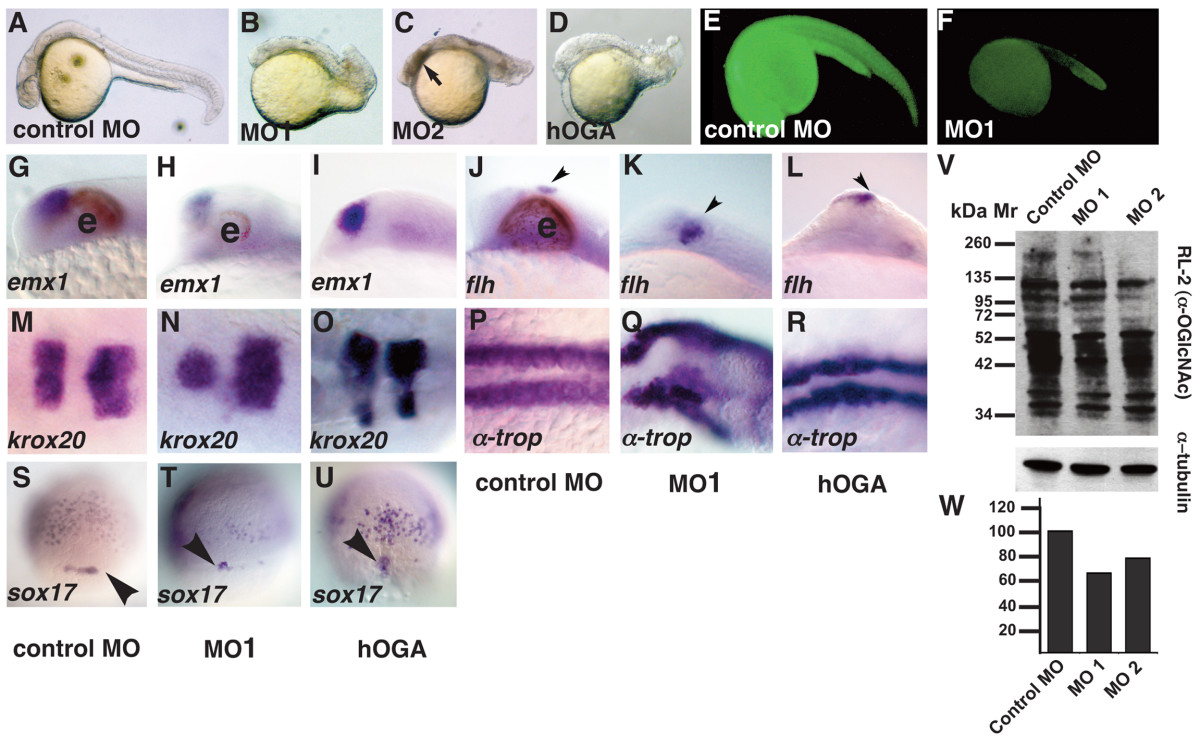
Fig. 2 Tissues from all three germ layers are reduced in ogt morphants. Comparison of ogt morphants and hOga expressing embryos with controls at 24 hpf (A-R) or 8 hpf (S-U). (B) Embryos injected with 7.5 ng MO1 (B), MO2 (C) or hOga (D) were smaller than controls (A), and had curved tails, small brains, reduced or absent eyes and shortened body axes. Necrotic tissue in the head from the MO injection is indicated (C, arrow)[86]. An Ogt-gfp fusion protein is translated in the presence of control MOs (E), but not in the presence of MO1 (F). In embryos injected with MO1 (H, K, arrowhead) or hOga (I, L, arrowhead), emx1 expression is slightly reduced compared to controls (G) and flh expression in the epiphysis is normal or slightly expanded. krox20 is expression is reduced in ogt morphants (N) and hOga expressing embryos (O). α-tropomyosin is reduced and disorganized in ogt morphants (Q) and hOga overexpressing embryos (R), reflecting the disorganization of the entire body axis. Fewer sox17 expressing endodermal precursor cells and dorsal forerunner cells are apparent in ogt morphants (T, arrowhead) and hOga overexpressing embryos (U, arrowhead). (V) Extracts from embryos injected with control MO (lane 1), MO1 (lane 2) or MO2 (lane 3) were probed with the RL2 monoclonal antibody (upper) or anti-tubulin antibody (lower). (W) Embryos injected with the control MO have 35% more O-GlcNAc modified protein than embryos injected with MO1 and 20% more than embryos injected with MO2. Anterior is to the left in A-R, dorsal views in S-U. e = eyes. Representative embryos are shown.

