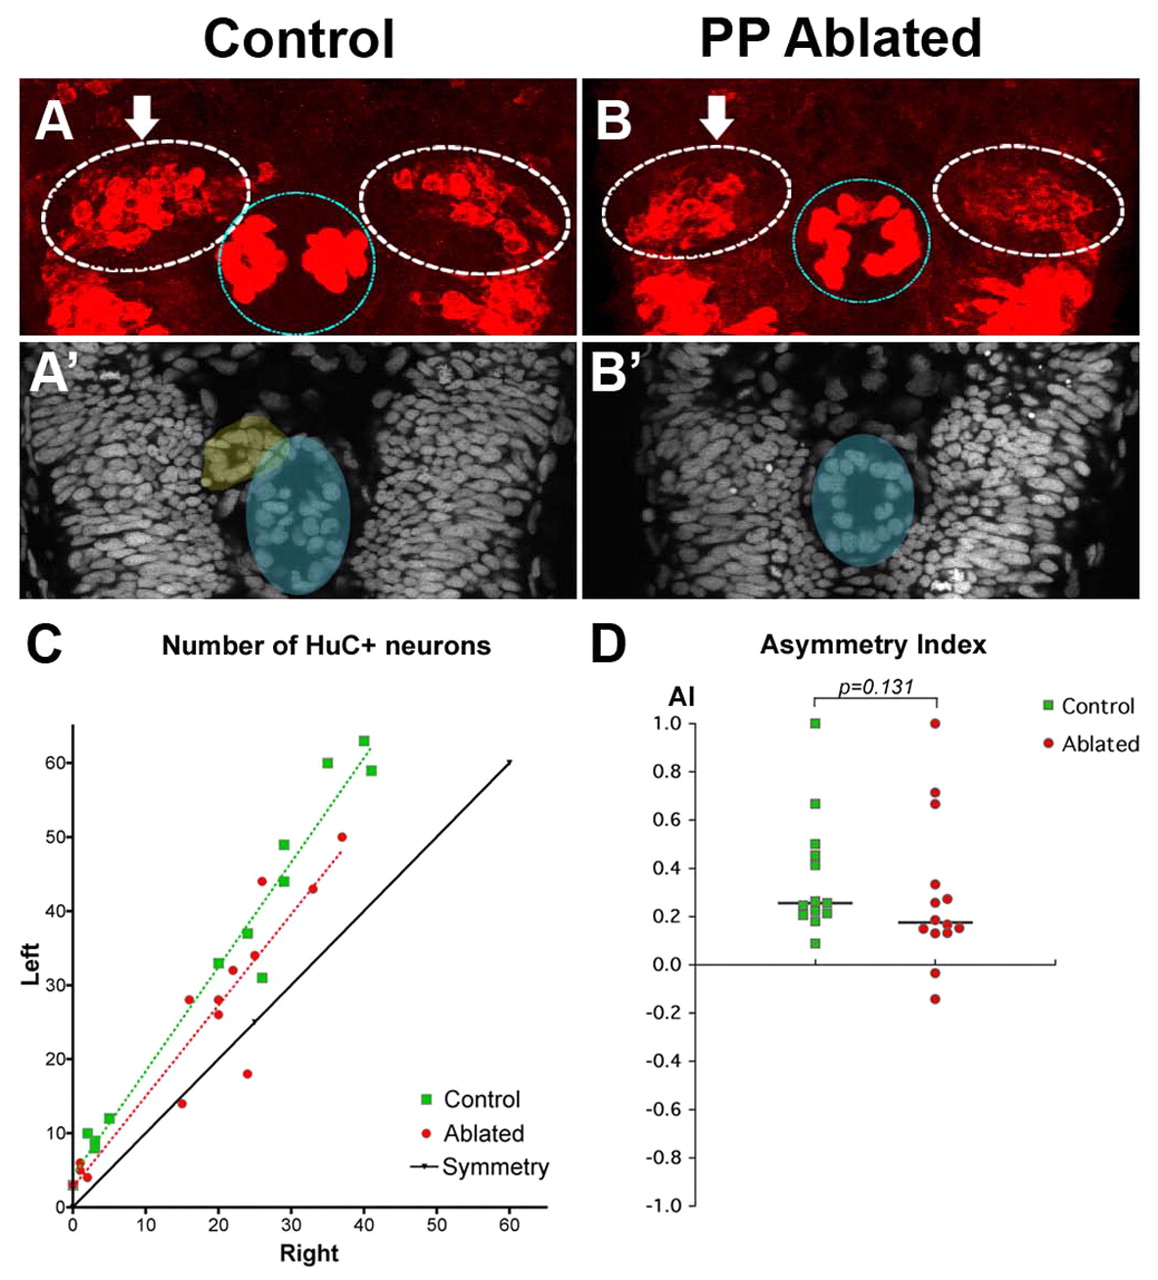
Fig. 4 Asymmetric habenular neurogenesis is independent of the parapineal. (A,B) Confocal projection of immuno-detected HuC/D proteins in 36-38 hpf control (A) and parapineal-ablated (B) zebrafish embryos. Arrows indicate the habenula with the higher number of HuC/D+ neurons. The habenulae are indicated by a dashed white line, the epiphysis by a blue line. (A′,B′) ToPro nuclear staining of the embryos in A,B reveals the parapineal in the control (yellow) but not in the parapineal-ablated embryo; the epiphysis is shaded blue. (C) Numbers of left versus right HuC+ habenular neurons with each point representing one embryo. A symmetry line (black) is included as a reference. The dotted lines represent the best-fit linear regression for controls and ablated embryos. (D) Asymmetry index (AI, see Materials and methods) plotted for each control or parapineal-ablated embryo. The horizontal black lines indicate the median AI value for the group of like-treated embryos.
Image
Figure Caption
Acknowledgments
This image is the copyrighted work of the attributed author or publisher, and
ZFIN has permission only to display this image to its users.
Additional permissions should be obtained from the applicable author or publisher of the image.
Full text @ Development

