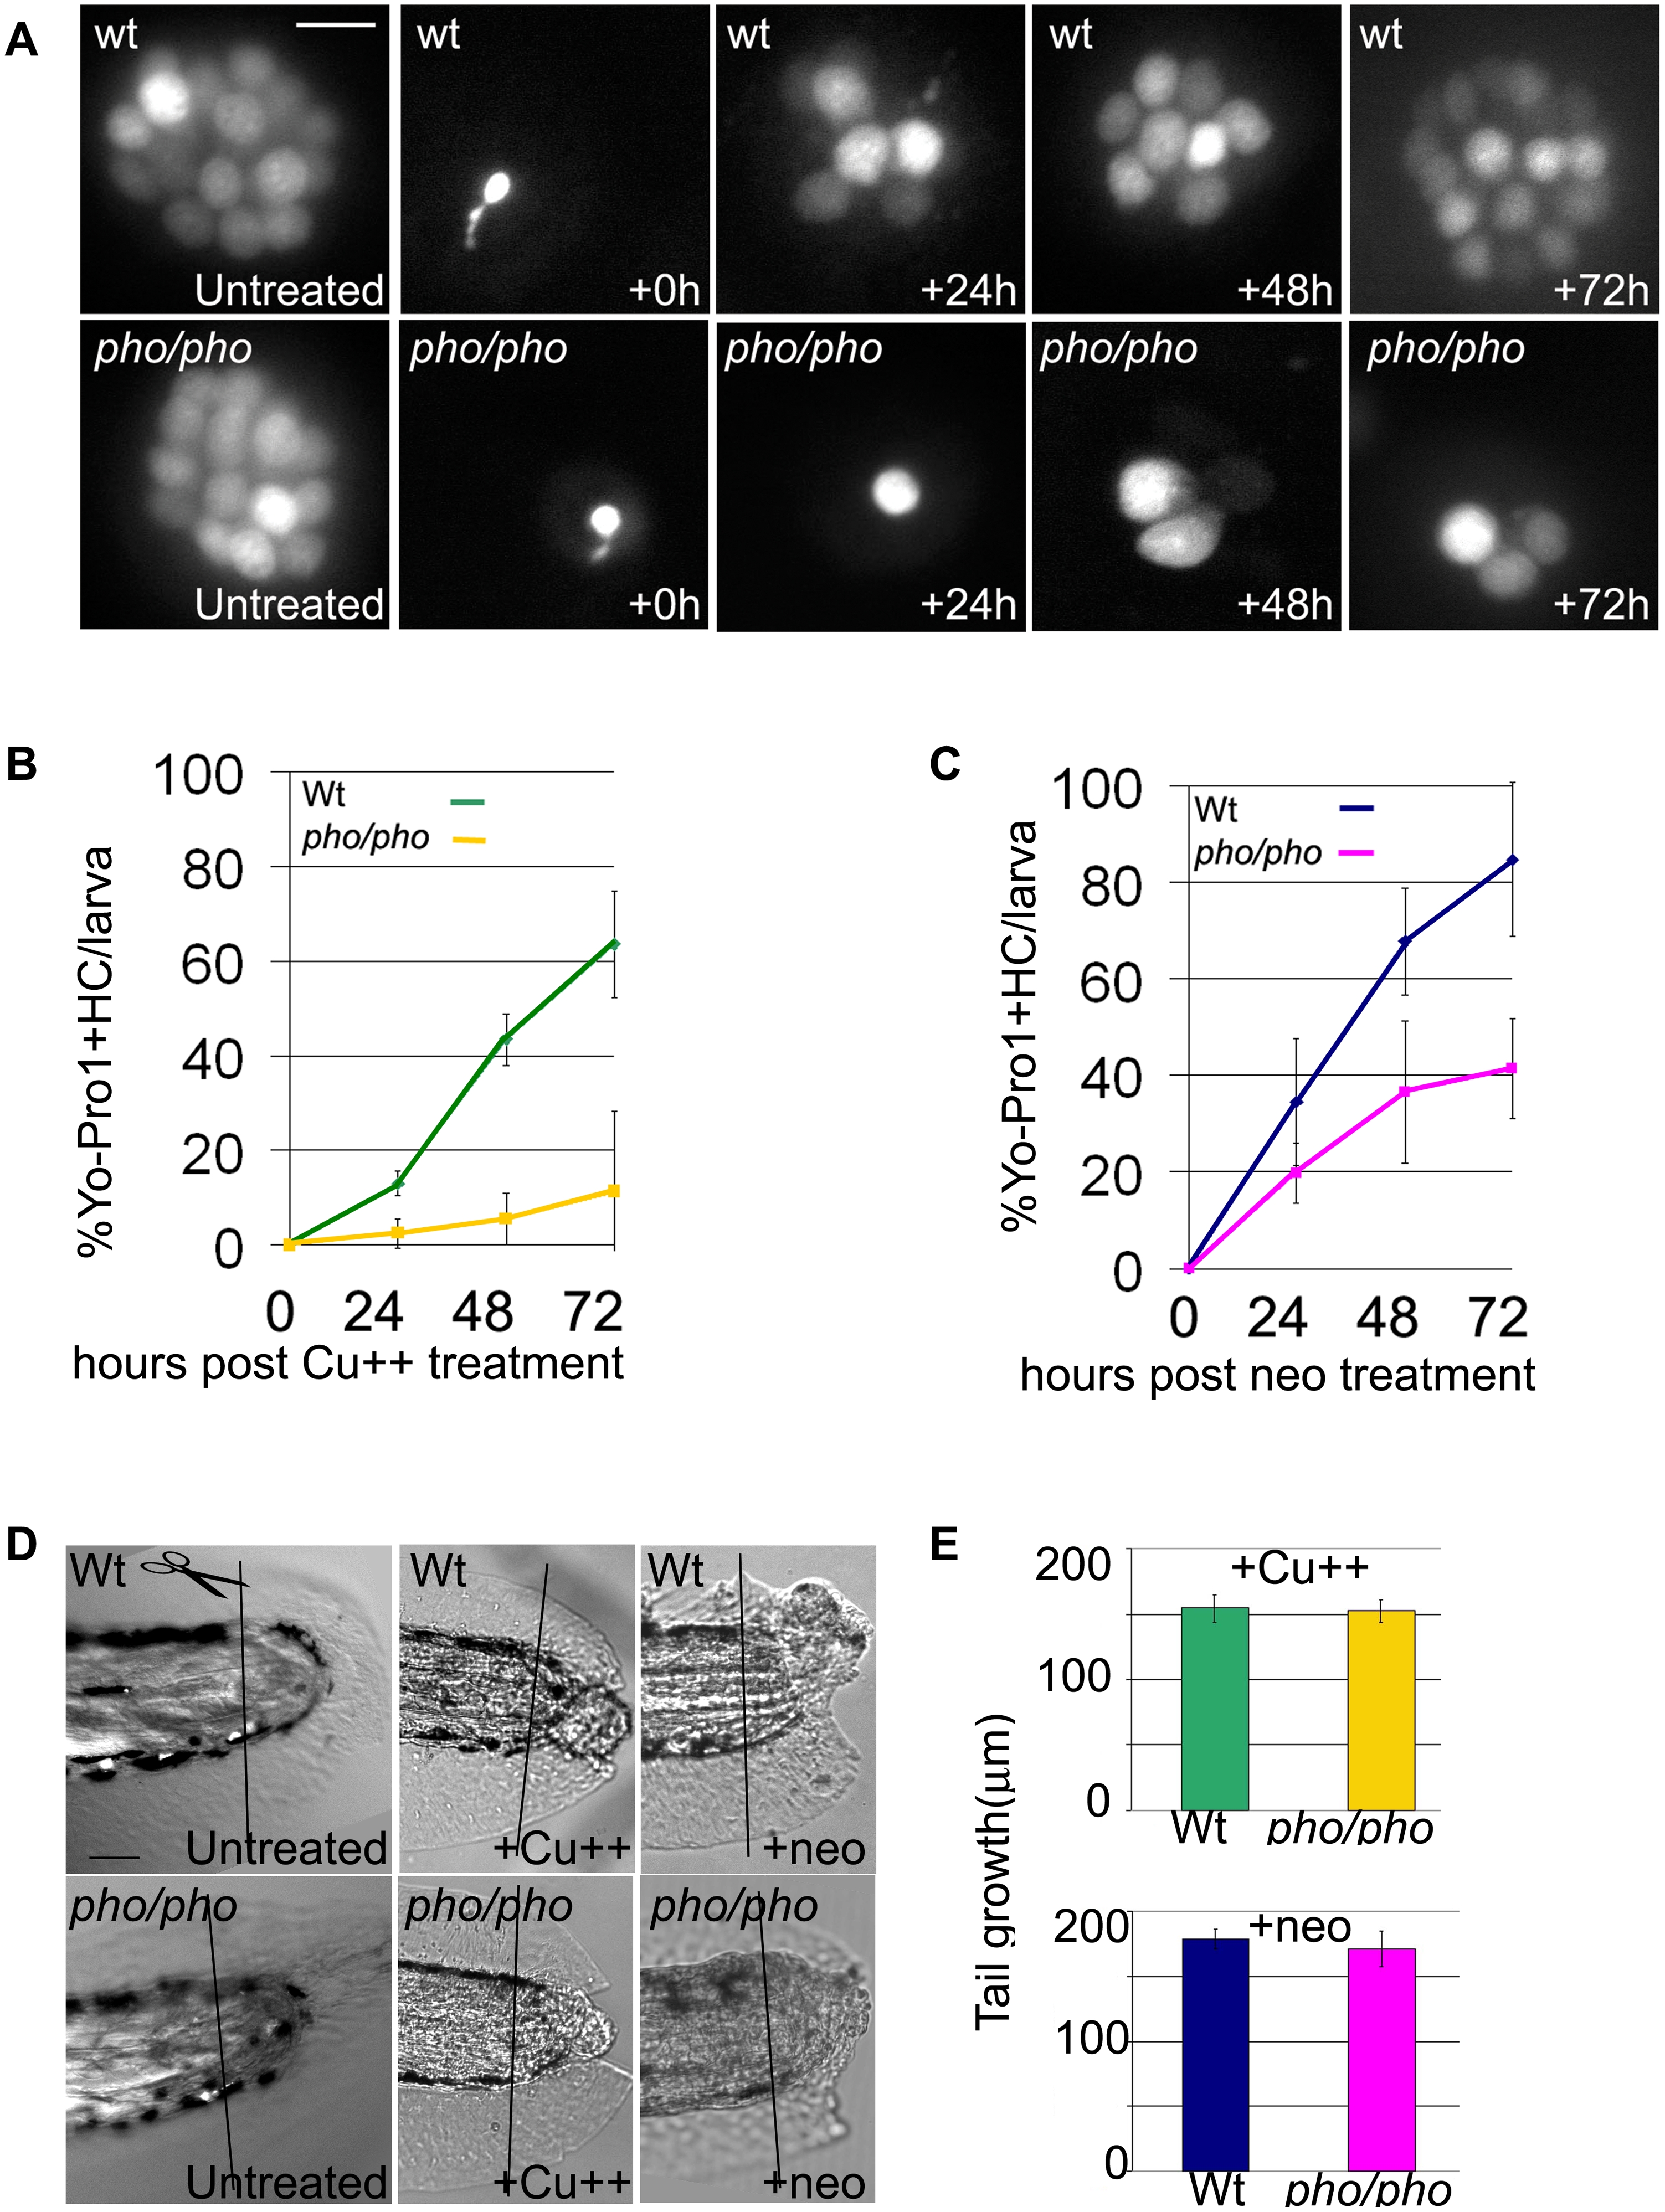
Fig. 3 Lateral line hair cell regeneration is severely reduced in phoenix mutants but regeneration in other tissues is not affected.
(A) Neuromasts of the lateral line are stained with YoPro 1, which exclusively stains hair cells. We treated wild-type (top panels) and pho/pho larvae (bottom panels) at 5dpf with copper (10mM). We monitored regeneration of hair cells over the following three days, at +24, +48, and +72h. As a reference, 5dpf wild-type and mutant neuromasts are shown just prior to treatment and just after the treatment (untreated and +0h, respectively, in the first and second columns from the left). (B) and (C) The number of hair cells was counted in untreated wild-type and mutant larvae at 5dpf (n = 39/53), 6dpf (n = 37/37), 7dpf (n = 23/22), and 8 dpf (n = 20/15). In each larva, we counted ten head neuromasts and all the tail neuromasts. We counted hair cells in healthy surviving larvae after 10 mM copper (B) or 200 mM neomycin (C) treatments. In (B), we counted wild-type (green line) and mutant (yellow line) larvae at +24h, (n = 40/36), +48h (n = 23/32), and +72h (n = 25/19), respectively, after copper treatment. In (C), we counted wild-type (blue line) and mutant (pink line) larvae at +24h, (n = 40/36), +48h (n = 23/32), and +72h (n = 25/19), respectively, after neomycin treatment. The numbers are presented as a percentage of regenerated hair cells in treated larvae, 100% being the respective number of hair cells at equivalent untreated wild-type and mutant stages. (D) We monitored the regeneration of tails in wild-type (top panels) and mutant (bottom panels) larvae. In untreated larvae (left panels), we amputated the tail at 3dpf and monitored the regeneration until 9dpf in wild-type (n = 8) and mutant (n = 20). We monitored the partial regeneration of tails amputated at 5dpf after copper (middle panels) and neomycin treatment (right panels). (E) Quantification of the tail regeneration after amputation at 5dpf after the copper treatment (upper graph), as measured in 8dpf wild-type (green, n = 11) and pho/pho (yellow, n = 10) larvae and after neomycin treatment (lower graph), as measured in 9dpf wild-type (dark blue, n = 6) and mutant (pink, n = 7) larvae. ? 10 microns in (A) and 50 microns in (D).

