
|
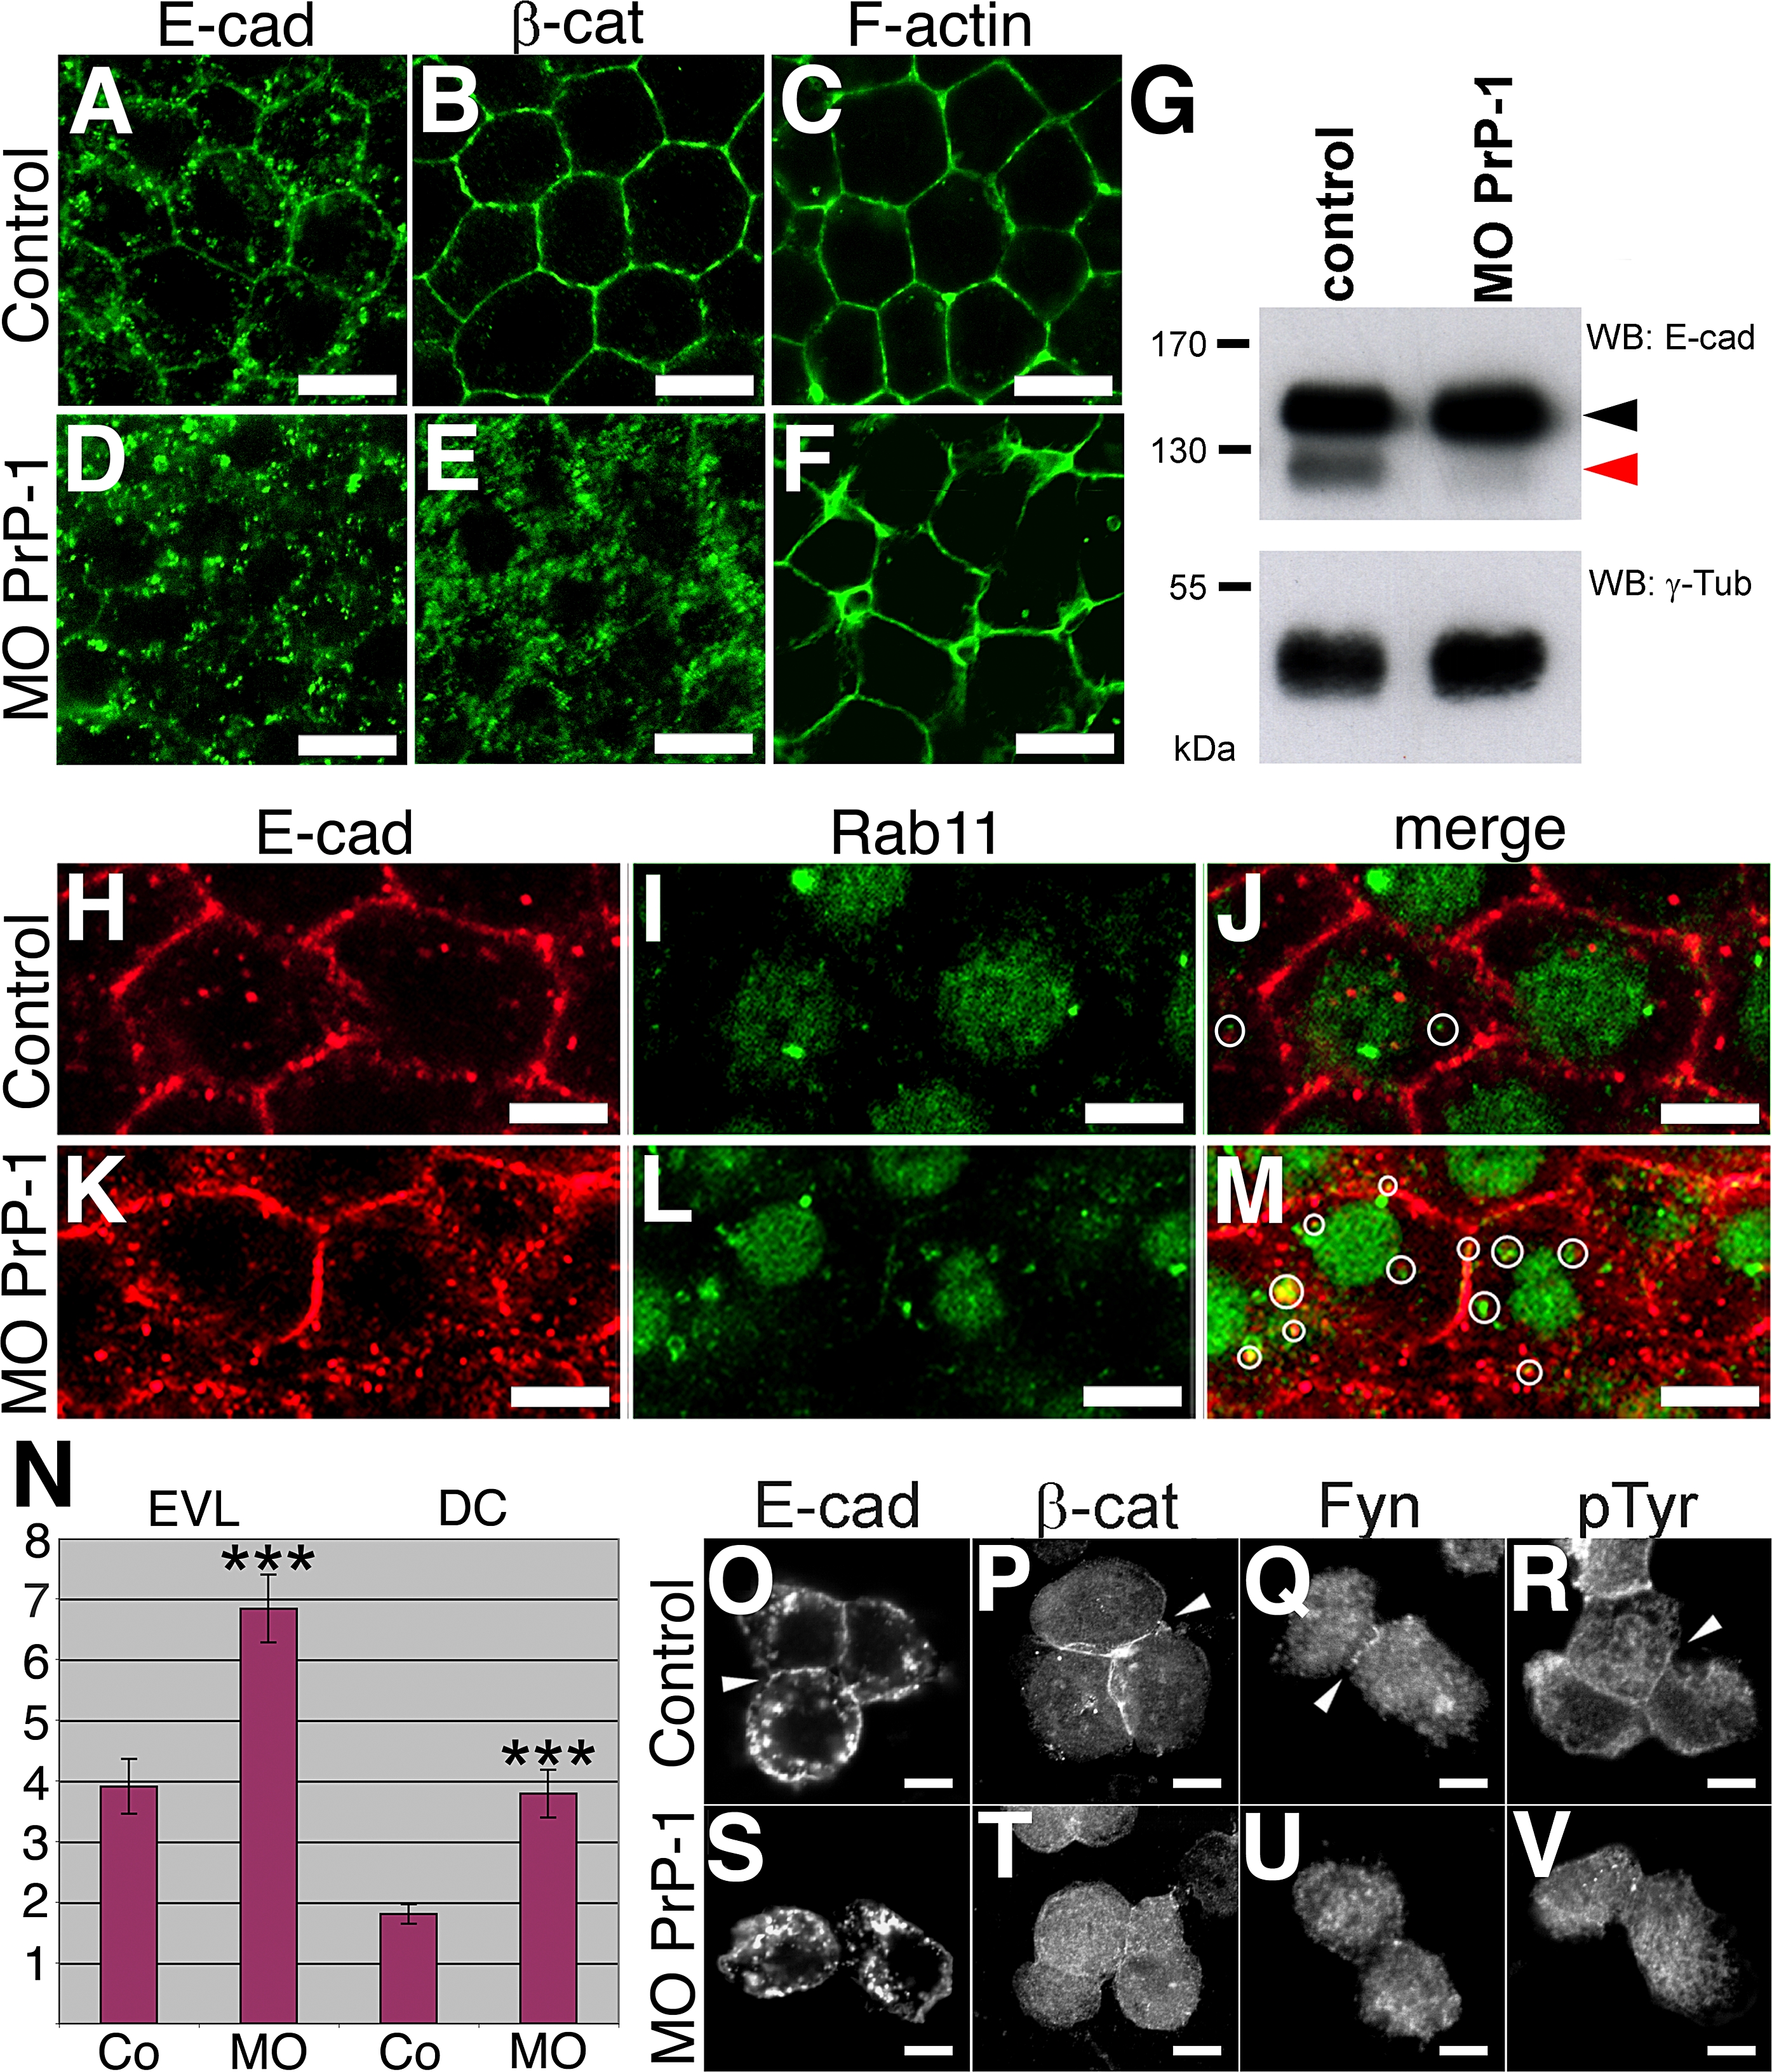
Fig. 6 Regulation of Cadherin-Mediated Cell Adhesion by PrP-1
Differences in the subcellular distribution of adherens junction components between control and PrP-1 morphant (MO) embryos were evaluated in the deep cell layer at the shield stage (6 hpf).
(A?F) The normal membrane localization of E-cadherin (E-cad [A]), β-catenin (β-cat [B]), and cortical F-actin (C) in control embryos appears disrupted upon PrP-1 knockdown (D?F).
(G) Western blot (WB) analysis of embryo cell extracts (6 hpf) reveals an almost complete reduction in the relative levels of mature E-cadherin (120 kDa, red arrowhead), and a slight increase in the levels of its immature form (140 kDa, black arrowhead) upon PrP-1 knockdown. γ-Tub, γ-tubulin.
(H?M) Changes in the number of Rab11-positive vesicles containing E-cadherin between control (Co [H?J]) and PrP-1 morphant embryos (K?M) were analyzed by immunostaining. Compared to control embryos, PrP-1 morphant embryos exhibit a higher density of E-cadherin/Rab11 double-positive vesicles in deep cells (white circles in [J and M]).
(N) The quantitative difference in the number of E-cadherin/Rab11 colocalizations per cell (y-axis) between control (Co) and PrP-1 morphant embryos (MO) was statistically significant for EVL (p = 0.0002) and DC (deep cells, p = 0.0004); triple asterisks (***) indicate statistical significance at p < 0.001. Error bars indicate SEM.
(O?V) Accumulation of E-cadherin (O), β-catenin (P), Fyn tyrosine kinase (Q), and phosphotyrosine staining (R) at cell contacts between primary blastomeres derived from control embryos (white arrowheads) is lost in PrP-1 morphant blastomeres (S, T, U, and V).
Scale bars in (A?F) indicate 10 μm; scale bars in (H?M and O?V) indicate 5 μm.