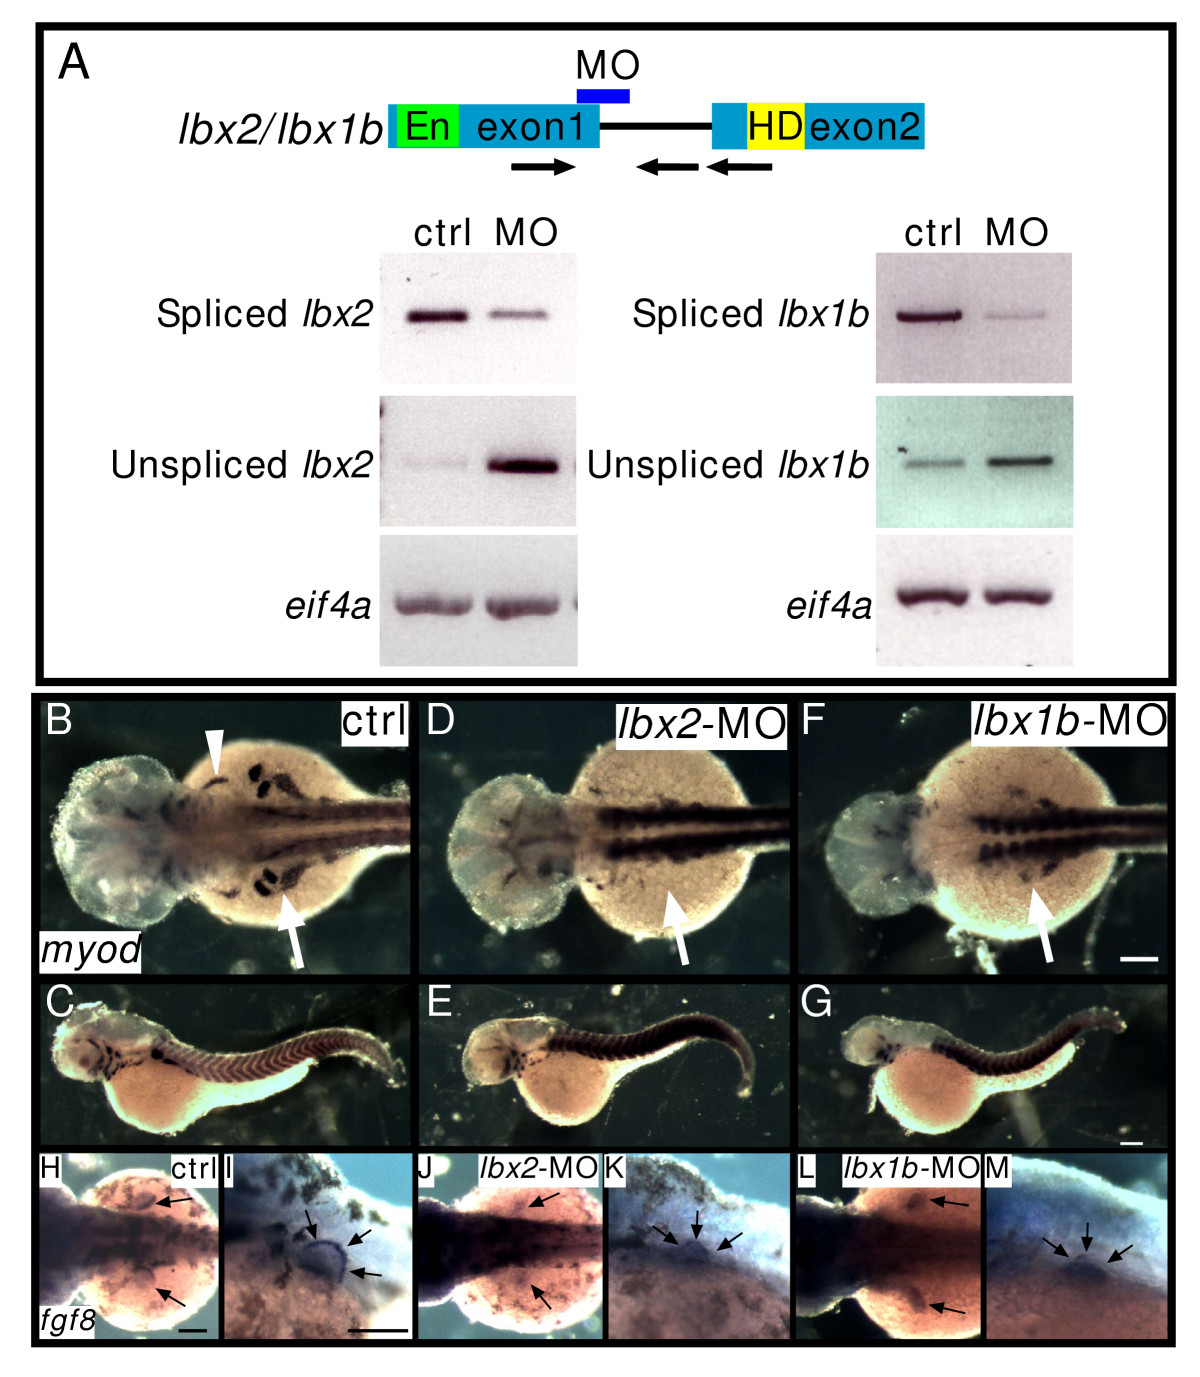
Fig. 2 Lbx2 and Lbx1b function in hypaxial muscle development. A: Splice donor MOs against lbx2 or lbx1b inhibit correct splicing of lbx2 or lbx1b, respectively. RT-PCR was performed using bud stage (lbx2) or segmentation stage (lbx1b) embryos. Spliced bands and unspliced bands in the lbx-splice donor-MO lane indicate aberrantly spliced message increases and correctly spliced message decreases. Arrows indicate primers. En: Engrailed domain, HD: homeodomain. Arrows indicate specific primers for amplification of correctly spliced or unspliced lbx genes. B-G: Expression of myod in control (ctrl) embryos (B, C), lbx2-MO injected embryos (D, E). lbx1b-MO injected embryos (F, G). The white arrowhead indicates the sternohyoideus primordium (B) and the white arrows indicate fin muscle precursors. myod expression in fin bud is suppressed by lbx2-MO or lbx1b-MO (B: 100%, n = 36; D: 12%, n = 56; F: 16%, n = 24). H-M: Expression of fgf8 in ectodermal cells of the fin bud. Control embryos (H, I, 100%, n = 12), lbx2-MO injected embryos (J-K, 100%, n = 12), lbx1b-MO injected embryos (L-M, 100%, n = 15). (B, D, F, H, J, L) Dorsal views, rostral towards the left, (C, E, G. I, K, M) lateral views, rostral toward the left, dorsal toward the top. Scale bar: (B-M) 100 μm.
Image
Figure Caption
Figure Data
Acknowledgments
This image is the copyrighted work of the attributed author or publisher, and
ZFIN has permission only to display this image to its users.
Additional permissions should be obtained from the applicable author or publisher of the image.
Full text @ BMC Dev. Biol.

