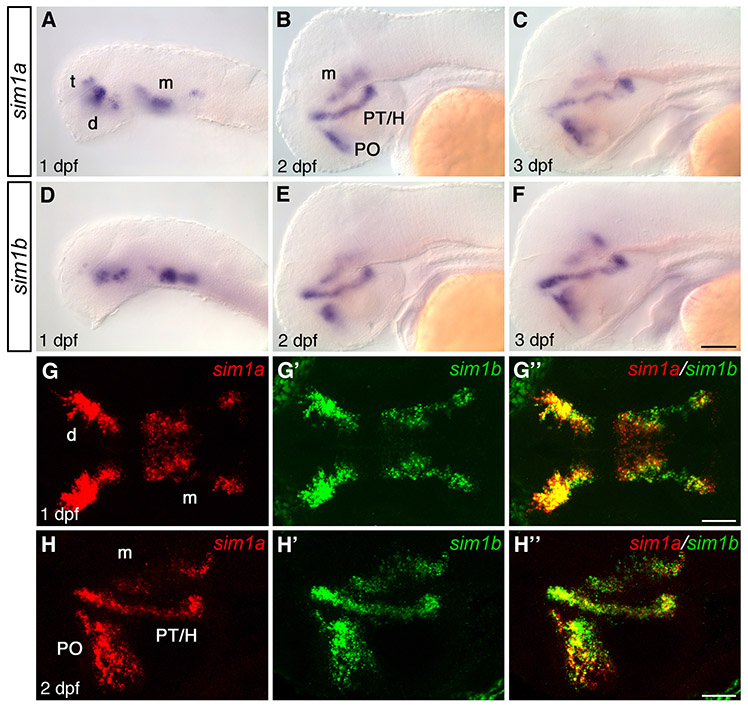
Fig. S4 Comparison of sim1a and sim1b expression in the embryonic brain. (A-F) Expression of sim1a (A-C) and sim1b (D-F) at 1 dpf (A,D), 2 dpf (B,E) and 3 dpf (C,F). Both sim1a and sim1b are expressed in the telencephalon, diencephalon and ventral midbrain in a highly similar pattern. (G-H″) Double fluorescent whole-mount in situ hybridization to detect coexpression of sim1a (G,H, red) and sim1b (G′,H′, green) at 1 dpf (G-G″, z-projection 30 μm) and 2 dpf (H-H″, z-projection 30 μm) revealing highly similar expression of both genes in all domains (merge views, G″,H″). (A-F,H-H″) Lateral views; (G-G″) dorsal views. Anterior is towards the left. Scale bars: in F, 100 μm for A-F; in H″, 50 μm for G-H″. Images in G,H″ represent z-projections from multiple adjacent confocal planes. Abbreviations: d, diencephalon; H, hypothalamus; m, mesencephalon; PO, posterior tuberculum; PO, preoptic region; t, telencephalon.
Image
Figure Caption
Acknowledgments
This image is the copyrighted work of the attributed author or publisher, and
ZFIN has permission only to display this image to its users.
Additional permissions should be obtained from the applicable author or publisher of the image.
Full text @ Development

